| Solar System Dynamics & Planetology Group |
|
C/2013 L2 Catalina | |
| Solar System Dynamics & Planetology Group |
|
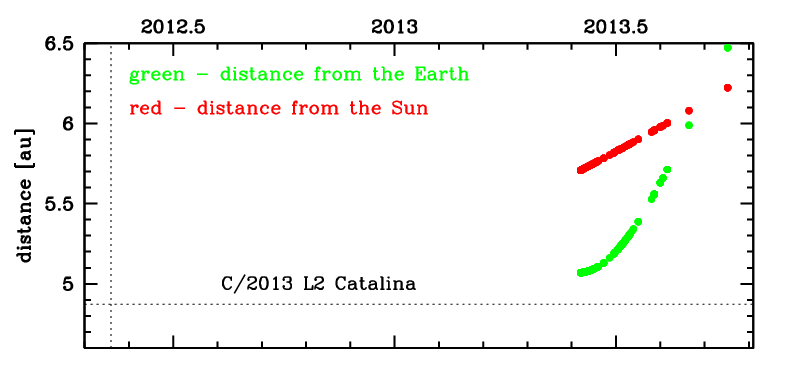
C/2013 L2 Catalina | |
| number of observations | 242 |
| number of residuals | 471 |
| data interval | 2013 June 2 — 2013 Oct. 1 |
| rms [arcsec] | 0.32 |
| orbit quality class |
| Epoch (TT) | 20130418.0 | = JD 2456400.5 |
| time of perihelion passage (TT) | 20120511.259254 | ± 0.006977 |
| perihelion distance | 4.87255449 | ± 0.00008139 |
| eccentricity | 1.00093442 | ± 0.00009181 |
| argument of perihelion [deg] | 1.949569 | ± 0.001554 |
| longitude of the ascending node [deg] | 285.875499 | ± 0.000539 |
| inclination [deg] | 106.774487 | ± 0.000434 |
| inverse semimajor axis [10-6 au-1] | -191.77 | ± 18.85 |

| Epoch (TT) | 17060607 | |
| time of perihelion passage (TT) | 20120510.939682 | ± 0.006943 |
| perihelion distance | 4.87338707 | ± 0.00008038 |
| eccentricity | 0.99955681 | ± 0.00009237 |
| argument of perihelion [deg] | 1.935539 | ± 0.001533 |
| longitude of the ascending node [deg] | 285.835153 | ± 0.000544 |
| inclination [deg] | 106.735662 | ± 0.000440 |
| inverse semimajor axis [10-6 au-1] | 90.94 | ± 18.95 |
| Epoch (TT) | 23191211 | |
| time of perihelion passage (TT) | 20120510.901490 | ± 0.007166 |
| perihelion distance | 4.87384876 | ± 0.00008052 |
| eccentricity | 0.99891263 | ± 0.00009238 |
| argument of perihelion [deg] | 1.887013 | ± 0.001532 |
| longitude of the ascending node [deg] | 285.849760 | ± 0.000544 |
| inclination [deg] | 106.751745 | ± 0.000439 |
| inverse semimajor axis [10-6 au-1] | 223.10 | ± 18.95 |