| Solar System Dynamics & Planetology Group |
|
C/2013 E1 McNaught | |
| Solar System Dynamics & Planetology Group |
|
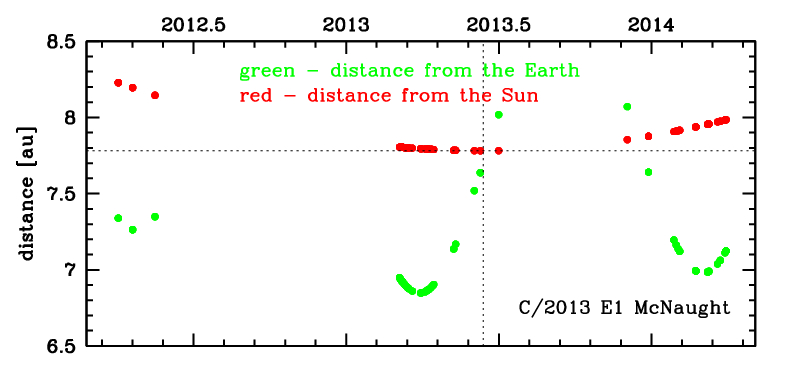
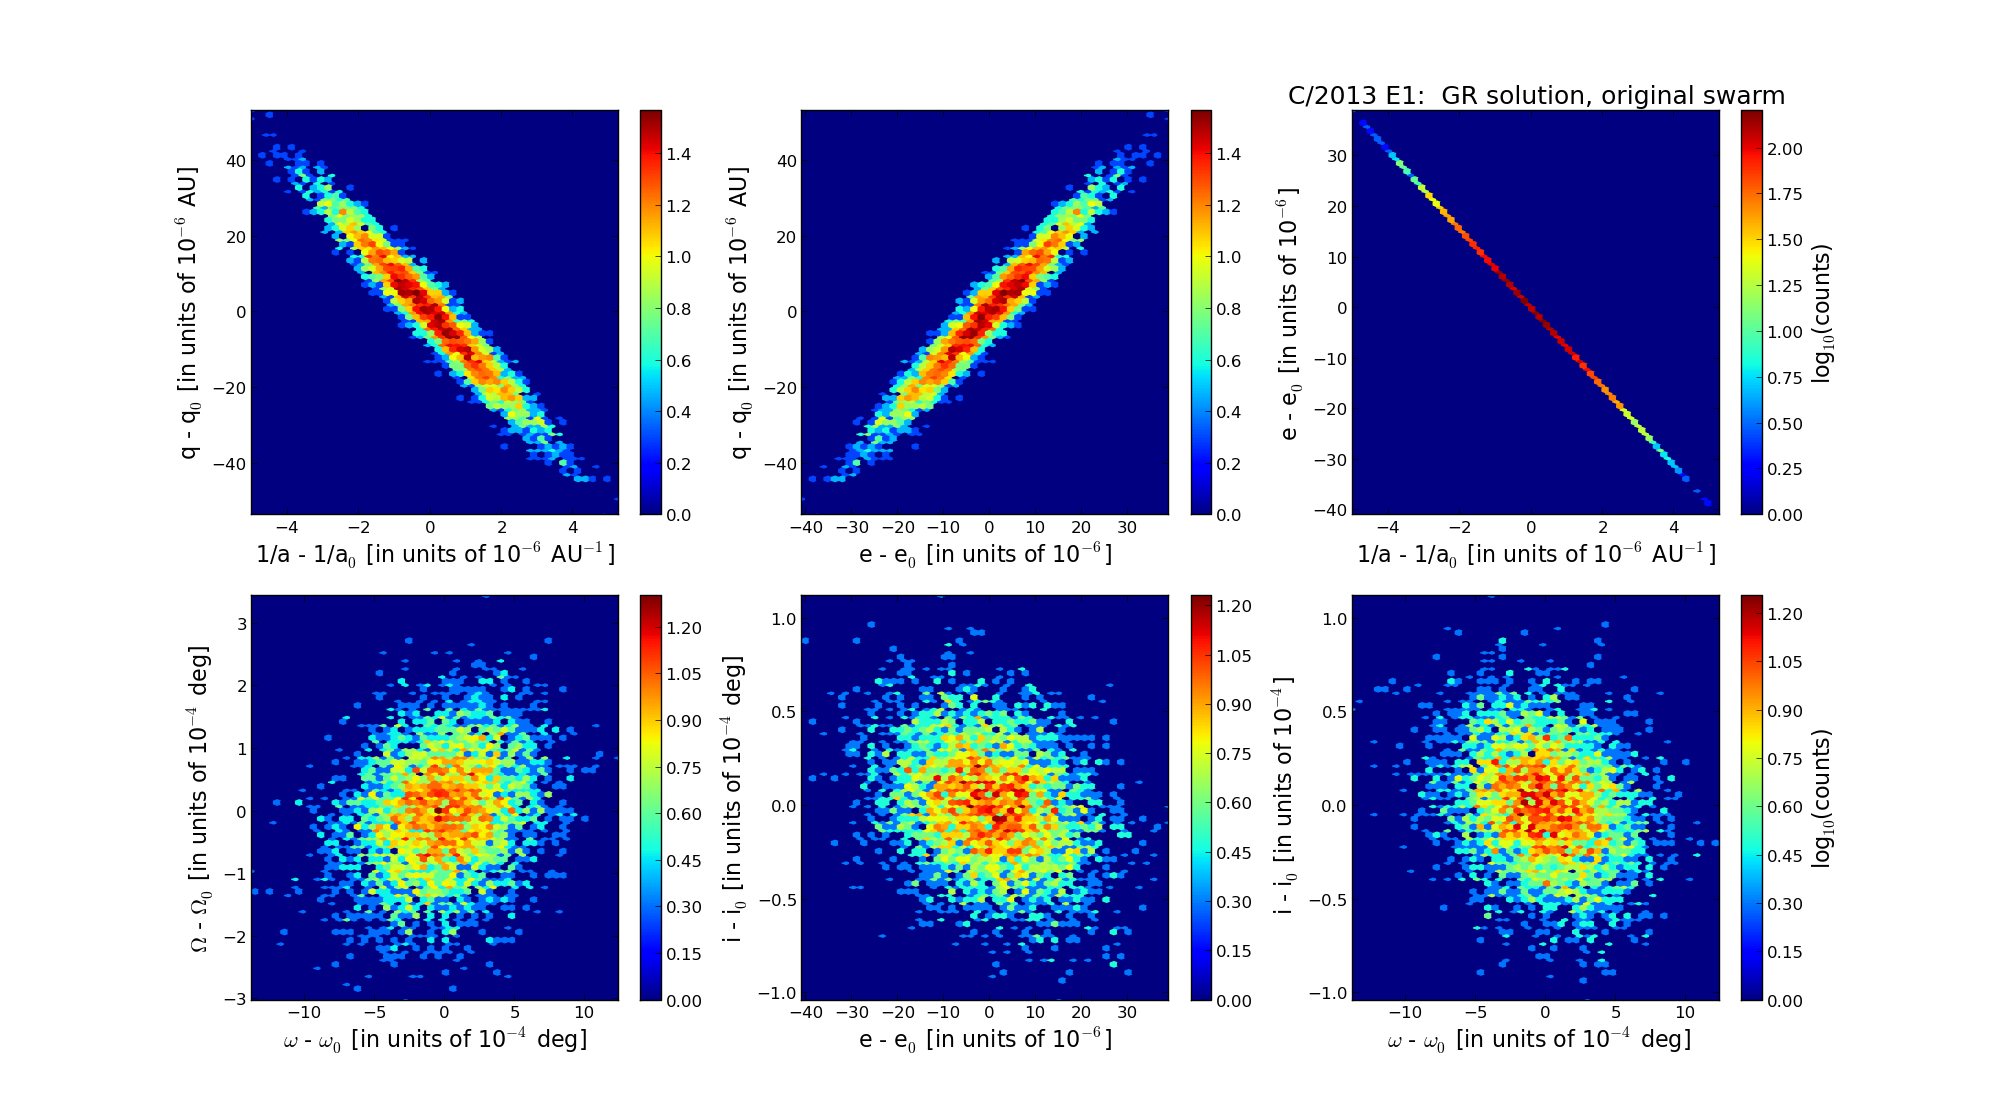
C/2013 E1 McNaught | |
| number of observations | 176 |
| number of residuals | 337 |
| data interval | 2012 Apr. 2 — 2014 Mar. 30 |
| rms [arcsec] | 0.39 |
| orbit quality class | 1a |
| Epoch (TT) | 20130528.0 | = JD 2456440.5 |
| time of perihelion passage (TT) | 20130612.112069 | ± 0.005205 |
| perihelion distance | 7.78161530 | ± 0.00001479 |
| eccentricity | 1.00232317 | ± 0.00001157 |
| argument of perihelion [deg] | 311.424878 | ± 0.000340 |
| longitude of the ascending node [deg] | 134.028198 | ± 0.000086 |
| inclination [deg] | 158.720554 | ± 0.000028 |
| inverse semimajor axis [10-6 au-1] | -298.55 | ± 1.48 |
| Epoch (TT) | 17030223 | |
| time of perihelion passage (TT) | 20130614.129439 | ± 0.005264 |
| perihelion distance | 7.77948378 | ± 0.00001514 |
| eccentricity | 0.99969113 | ± 0.00001142 |
| argument of perihelion [deg] | 311.468848 | ± 0.000341 |
| longitude of the ascending node [deg] | 133.929667 | ± 0.000087 |
| inclination [deg] | 158.699209 | ± 0.000028 |
| inverse semimajor axis [10-6 au-1] | 39.70 | ± 1.47 |

| Epoch (TT) | 23240607 | |
| time of perihelion passage (TT) | 20130614.078381 | ± 0.005243 |
| perihelion distance | 7.78412933 | ± 0.00001460 |
| eccentricity | 0.99933317 | ± 0.00001144 |
| argument of perihelion [deg] | 311.566551 | ± 0.000343 |
| longitude of the ascending node [deg] | 134.036610 | ± 0.000087 |
| inclination [deg] | 158.729812 | ± 0.000028 |
| inverse semimajor axis [10-6 au-1] | 85.67 | ± 1.47 |