| Solar System Dynamics & Planetology Group |
|
C/2012 A1 PanSTARRS | |
| Solar System Dynamics & Planetology Group |
|
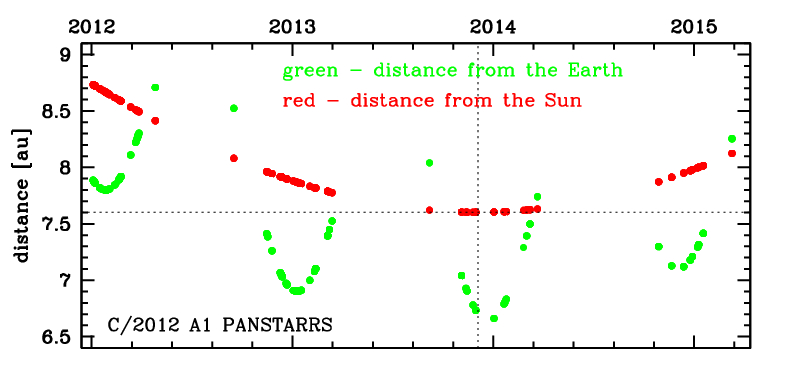
C/2012 A1 PanSTARRS | |
| number of observations | 330 |
| number of residuals | 653 |
| data interval | 2012 Jan. 2 — 2015 Mar. 9 |
| rms [arcsec] | 0.40 |
| orbit quality class | 1a+ |
| Epoch (TT) | 20131214.0 | = JD 2456640.5 |
| time of perihelion passage (TT) | 20131202.218131 | ± 0.001173 |
| perihelion distance | 7.60253338 | ± 0.00000787 |
| eccentricity | 1.00164070 | ± 0.00000730 |
| argument of perihelion [deg] | 191.934807 | ± 0.000071 |
| longitude of the ascending node [deg] | 277.971479 | ± 0.000007 |
| inclination [deg] | 120.910023 | ± 0.000014 |
| inverse semimajor axis [10-6 au-1] | -215.81 | ± 0.96 |

| Epoch (TT) | 17030514 | |
| time of perihelion passage (TT) | 20131130.413300 | ± 0.001163 |
| perihelion distance | 7.59939009 | ± 0.00000784 |
| eccentricity | 0.99937163 | ± 0.00000724 |
| argument of perihelion [deg] | 191.830837 | ± 0.000071 |
| longitude of the ascending node [deg] | 277.961310 | ± 0.000007 |
| inclination [deg] | 120.933007 | ± 0.000014 |
| inverse semimajor axis [10-6 au-1] | 82.69 | ± 0.95 |
| Epoch (TT) | 23250602 | |
| time of perihelion passage (TT) | 20131201.707717 | ± 0.001164 |
| perihelion distance | 7.59862542 | ± 0.00000785 |
| eccentricity | 0.99879397 | ± 0.00000724 |
| argument of perihelion [deg] | 191.892635 | ± 0.000071 |
| longitude of the ascending node [deg] | 277.978070 | ± 0.000007 |
| inclination [deg] | 120.938298 | ± 0.000014 |
| inverse semimajor axis [10-6 au-1] | 158.72 | ± 0.95 |