| Solar System Dynamics & Planetology Group |
|
C/2010 S1 LINEAR | |
| Solar System Dynamics & Planetology Group |
|
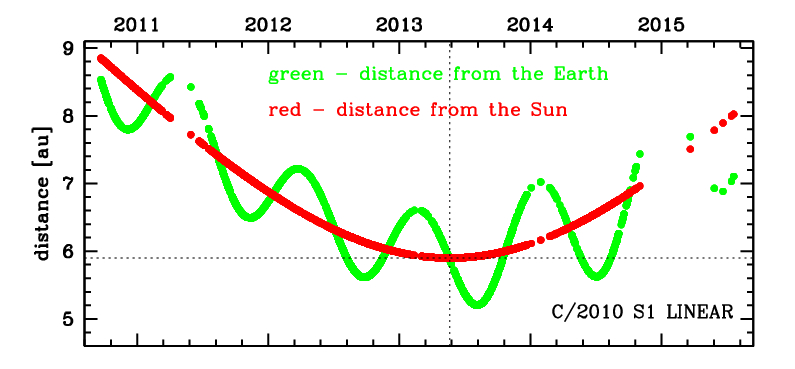
C/2010 S1 LINEAR | |
| number of observations | 8578 |
| number of residuals | 17046 |
| data interval | 2010 Sep. 21 — 2015 July 19 |
| rms [arcsec] | 0.44 |
| orbit quality class | 1a+ |
| Epoch (TT) | 20130528.0 | = JD 2456440.5 |
| time of perihelion passage (TT) | 20130520.299392 | ± 0.000128 |
| perihelion distance | 5.89989428 | ± 0.00000081 |
| eccentricity | 1.00191132 | ± 0.00000090 |
| argument of perihelion [deg] | 118.614738 | ± 0.000012 |
| longitude of the ascending node [deg] | 93.430361 | ± 0.000003 |
| inclination [deg] | 125.335777 | ± 0.000002 |
| inverse semimajor axis [10-6 au-1] | -323.96 | ± 0.15 |

| Epoch (TT) | 17060607 | |
| time of perihelion passage (TT) | 20130519.845418 | ± 0.000128 |
| perihelion distance | 5.90058690 | ± 0.00000094 |
| eccentricity | 0.99985254 | ± 0.00000089 |
| argument of perihelion [deg] | 118.594574 | ± 0.000012 |
| longitude of the ascending node [deg] | 93.453927 | ± 0.000003 |
| inclination [deg] | 125.320357 | ± 0.000002 |
| inverse semimajor axis [10-6 au-1] | 24.99 | ± 0.15 |
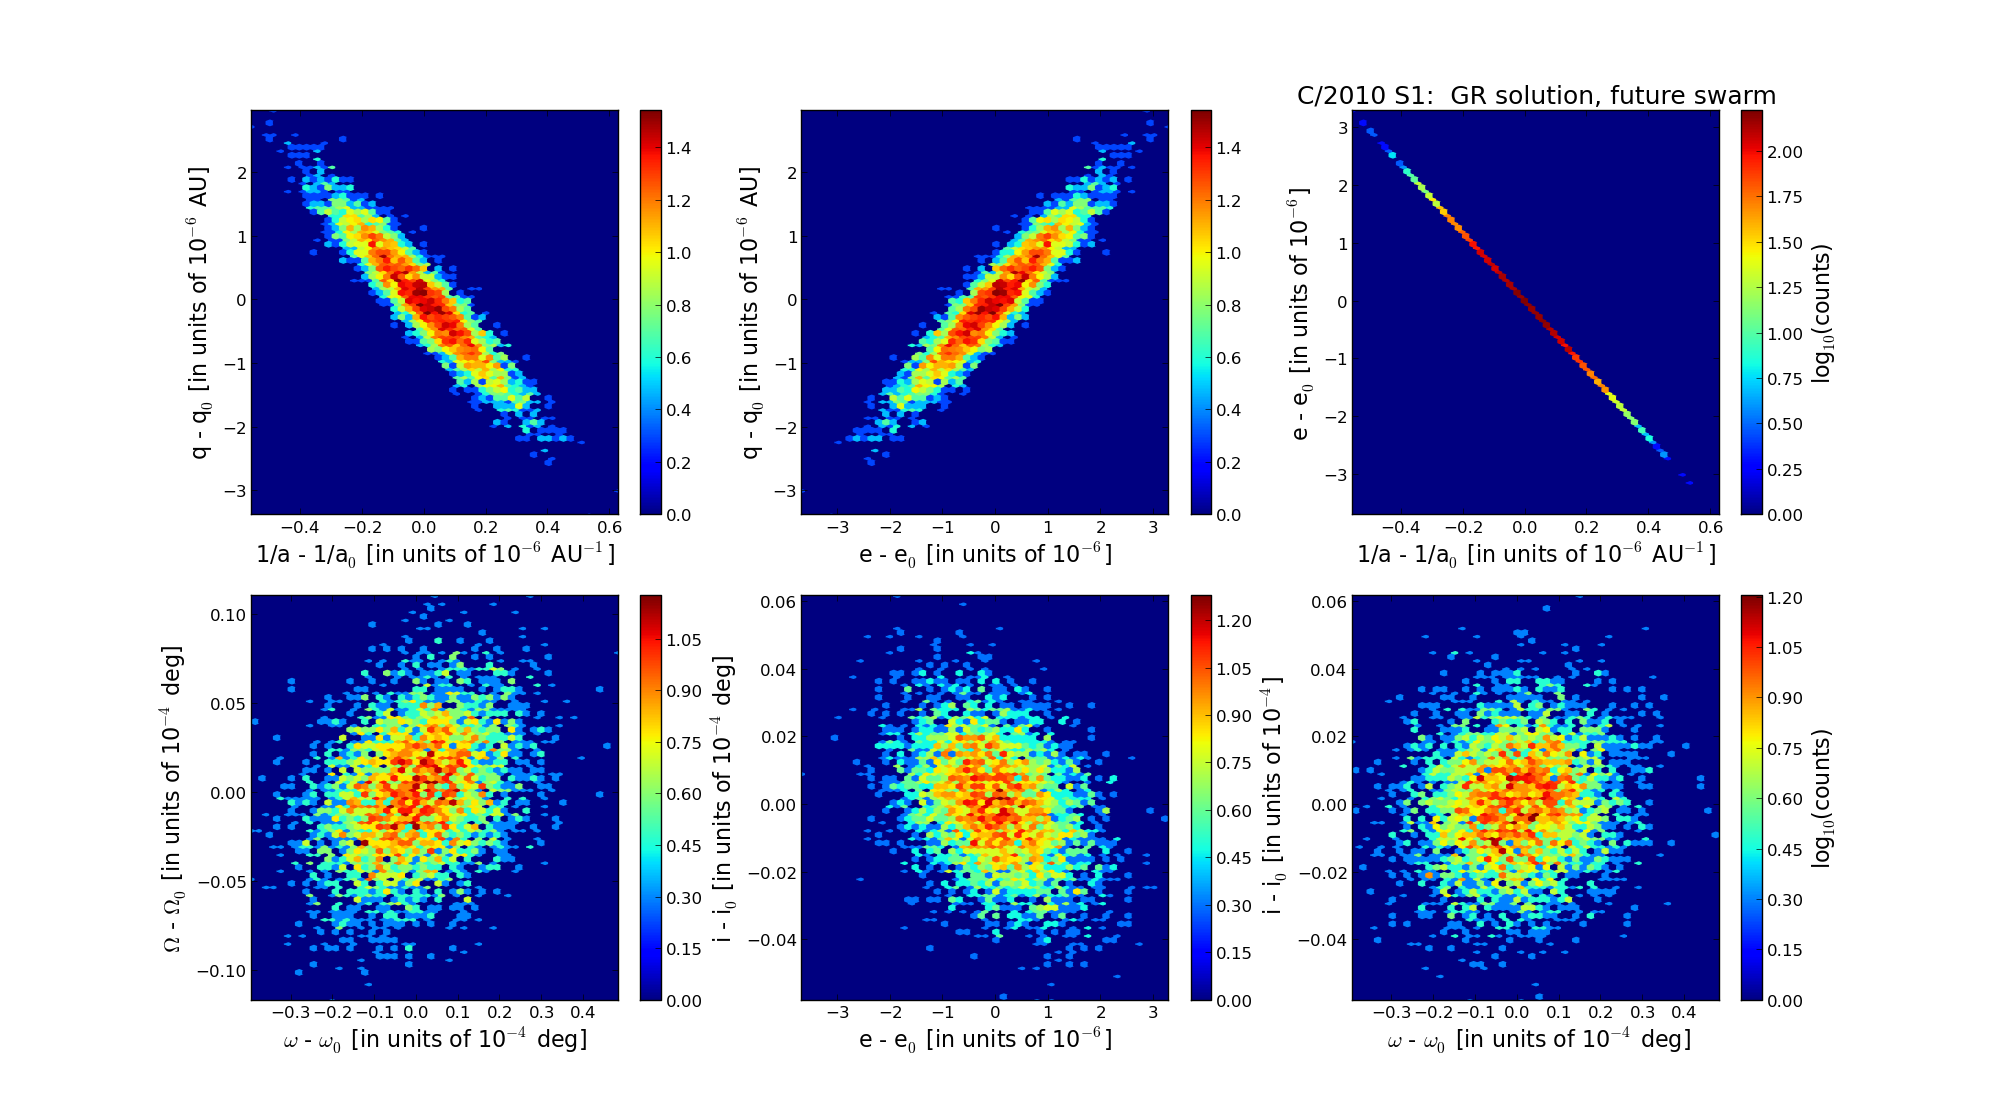
| Epoch (TT) | 23201205 | |
| time of perihelion passage (TT) | 20130519.360295 | ± 0.000129 |
| perihelion distance | 5.89477684 | ± 0.00000080 |
| eccentricity | 0.99954820 | ± 0.00000089 |
| argument of perihelion [deg] | 118.512138 | ± 0.000012 |
| longitude of the ascending node [deg] | 93.485886 | ± 0.000003 |
| inclination [deg] | 125.361025 | ± 0.000002 |
| inverse semimajor axis [10-6 au-1] | 76.64 | ± 0.15 |