| Solar System Dynamics & Planetology Group |
|
C/2010 R1 LINEAR | |
| Solar System Dynamics & Planetology Group |
|
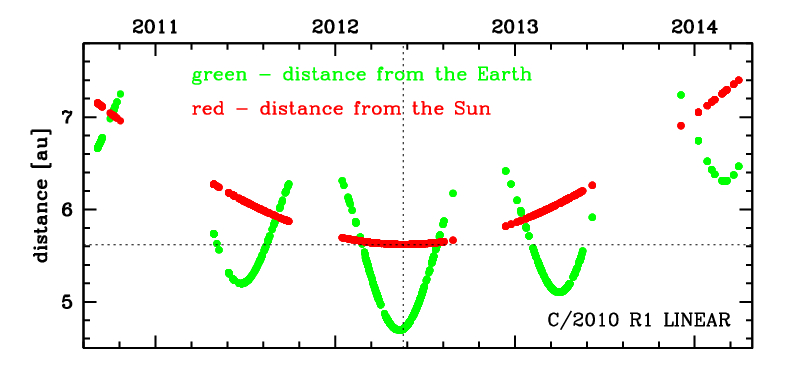
C/2010 R1 LINEAR | |
| number of observations | 1619 |
| number of residuals | 3198 |
| data interval | 2010 Sep. 4 — 2014 Mar. 30 |
| rms [arcsec] | 0.44 |
| orbit quality class |
| Epoch (TT) | 20120602.0 | = JD 2456080.5 |
| time of perihelion passage (TT) | 20120518.897181 | ± 0.000303 |
| perihelion distance | 5.62142194 | ± 0.00000241 |
| eccentricity | 1.00366511 | ± 0.00000283 |
| argument of perihelion [deg] | 114.496303 | ± 0.000034 |
| longitude of the ascending node [deg] | 343.649440 | ± 0.000016 |
| inclination [deg] | 156.933395 | ± 0.000004 |
| inverse semimajor axis [10-6 au-1] | -651.99 | ± 0.50 |

| Epoch (TT) | 17050831 | |
| time of perihelion passage (TT) | 20120518.570864 | ± 0.000305 |
| perihelion distance | 5.62134696 | ± 0.00000230 |
| eccentricity | 0.99975643 | ± 0.00000280 |
| argument of perihelion [deg] | 114.531775 | ± 0.000035 |
| longitude of the ascending node [deg] | 343.648198 | ± 0.000017 |
| inclination [deg] | 156.925538 | ± 0.000004 |
| inverse semimajor axis [10-6 au-1] | 43.33 | ± 0.50 |
| Epoch (TT) | 23190704 | |
| time of perihelion passage (TT) | 20120518.214741 | ± 0.000307 |
| perihelion distance | 5.62509247 | ± 0.00000236 |
| eccentricity | 0.99957458 | ± 0.00000280 |
| argument of perihelion [deg] | 114.527998 | ± 0.000035 |
| longitude of the ascending node [deg] | 343.702379 | ± 0.000017 |
| inclination [deg] | 156.950481 | ± 0.000004 |
| inverse semimajor axis [10-6 au-1] | 75.63 | ± 0.50 |