| Solar System Dynamics & Planetology Group |
|
C/2010 L3 Catalina | |
| Solar System Dynamics & Planetology Group |
|
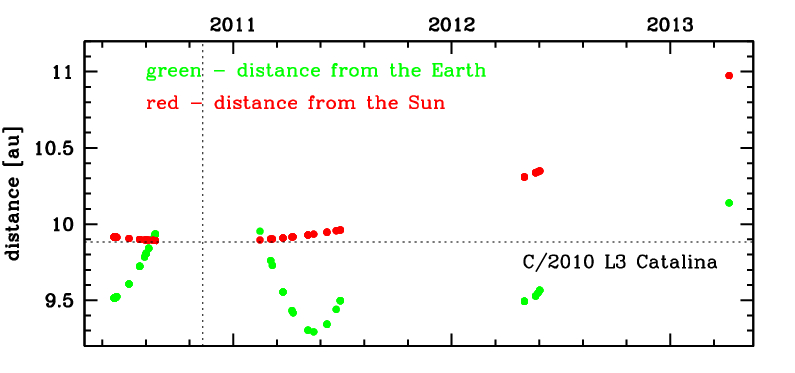
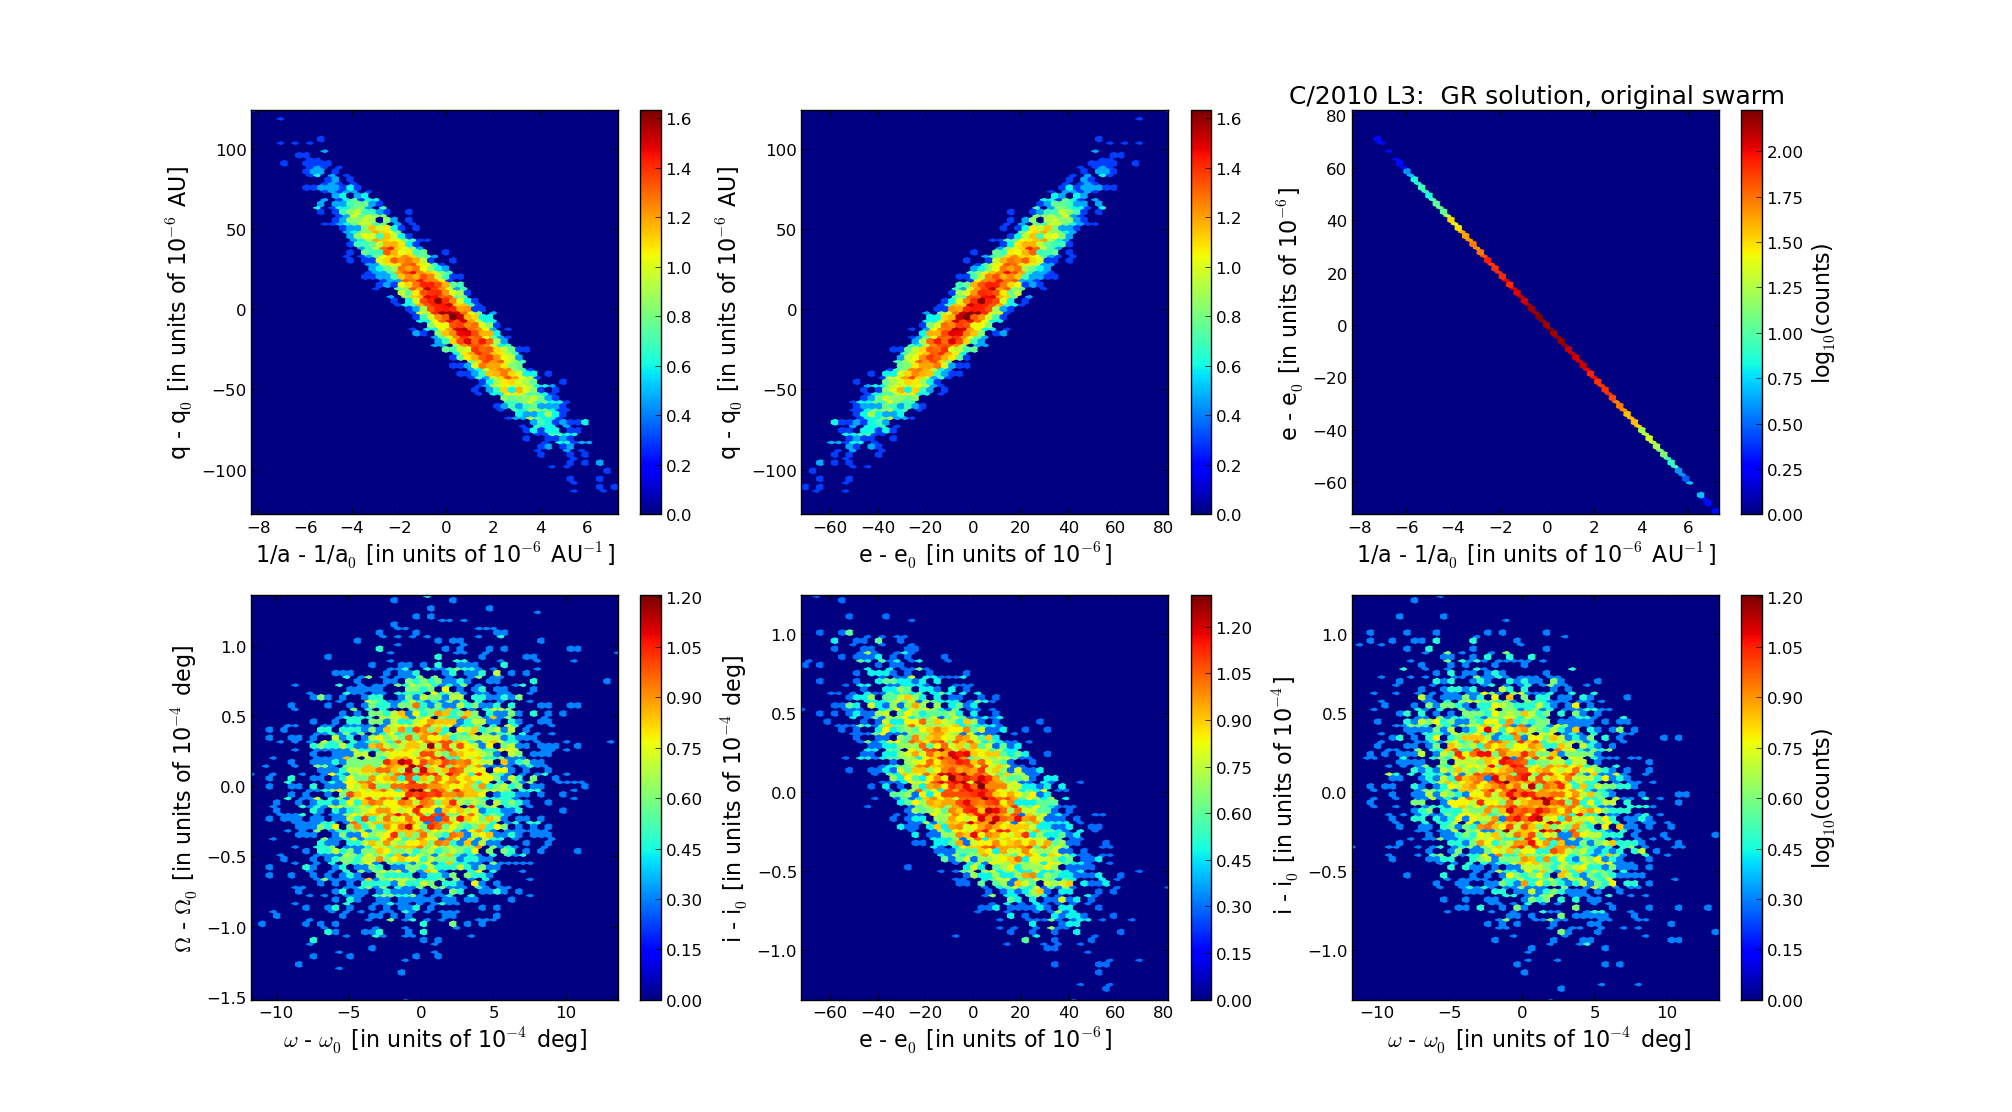
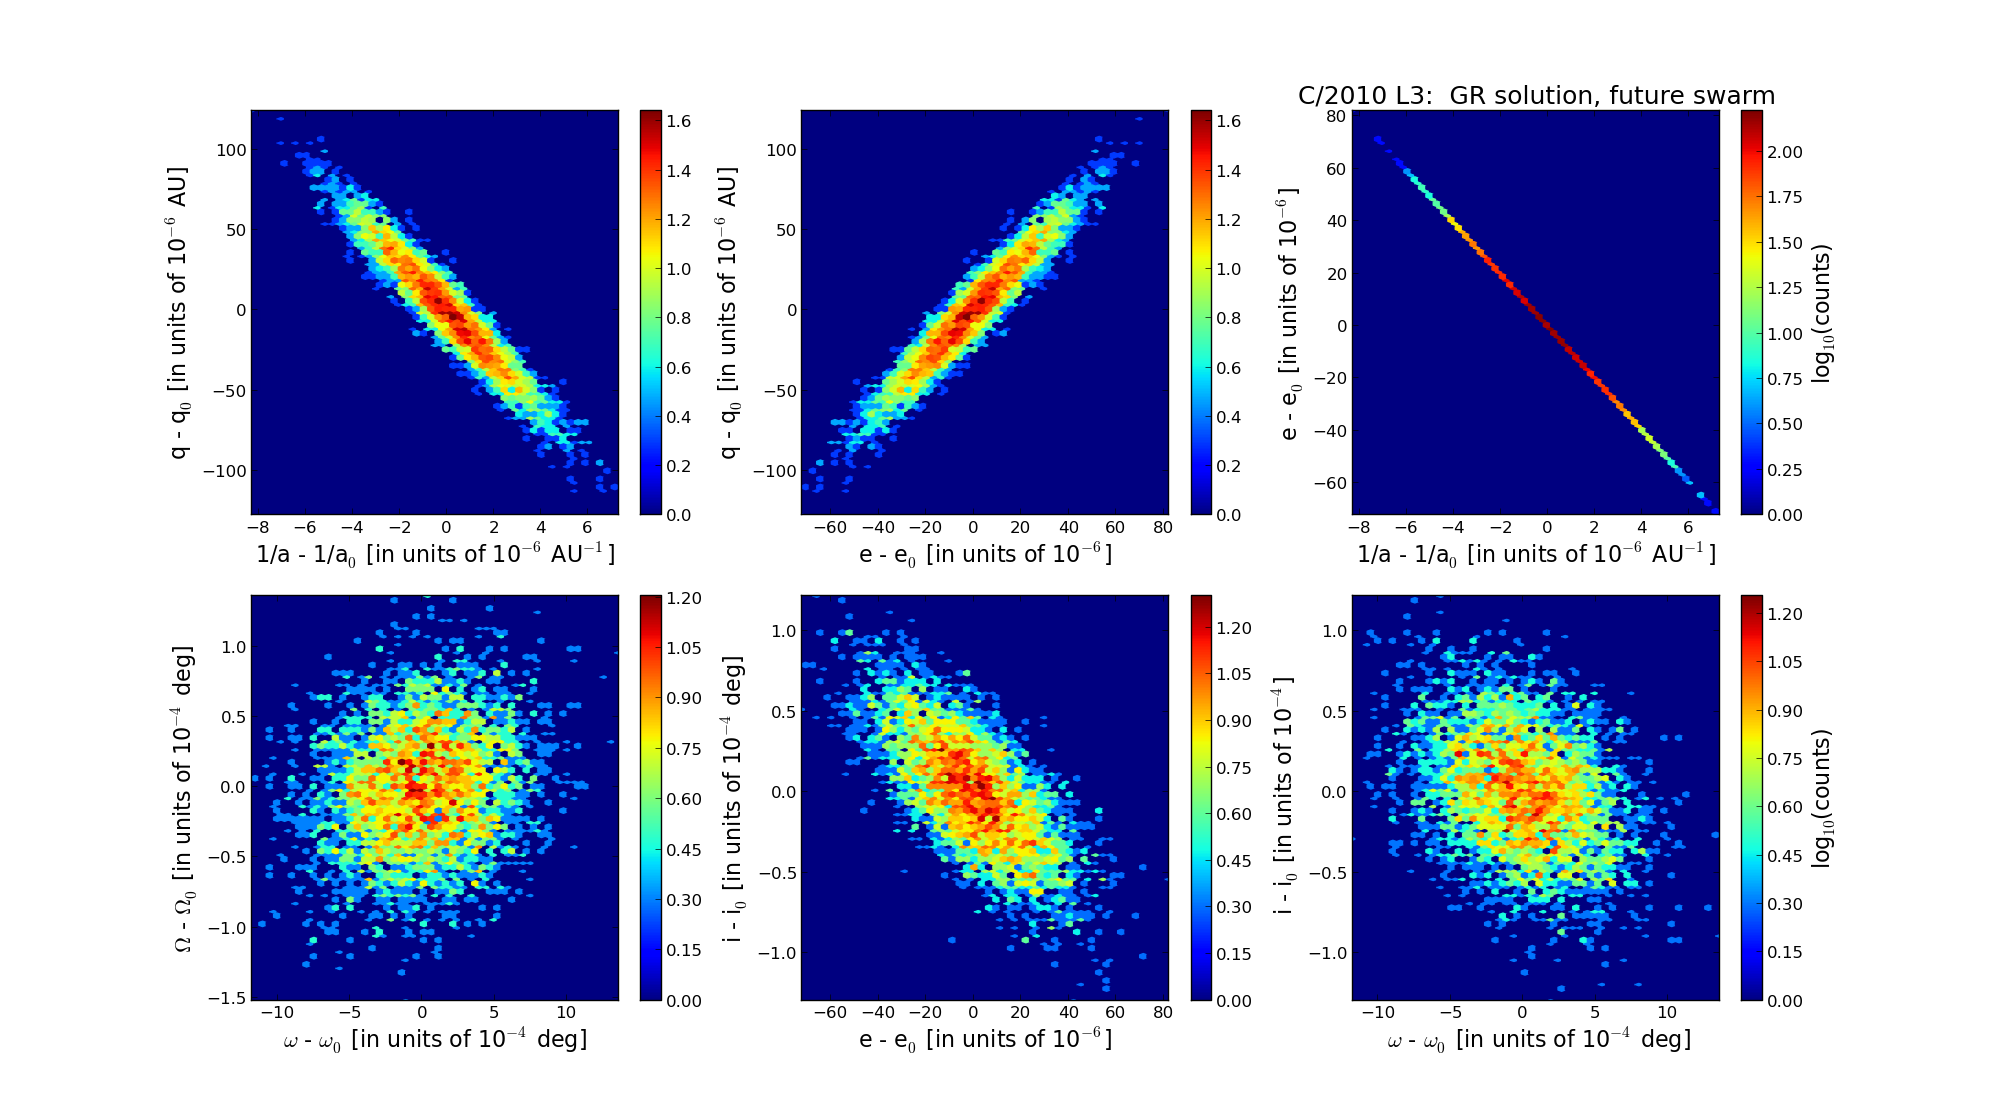
C/2010 L3 Catalina | |
| number of observations | 123 |
| number of residuals | 245 |
| data interval | 2010 June 15 — 2013 Apr. 8 |
| rms [arcsec] | 0.39 |
| orbit quality class | 1a |
| Epoch (TT) | 20101120.0 | = JD 2455520.5 |
| time of perihelion passage (TT) | 20101110.470765 | ± 0.008271 |
| perihelion distance | 9.88282514 | ± 0.00003420 |
| eccentricity | 0.99909456 | ± 0.00002132 |
| argument of perihelion [deg] | 121.774413 | ± 0.000361 |
| longitude of the ascending node [deg] | 38.276041 | ± 0.000041 |
| inclination [deg] | 102.630673 | ± 0.000036 |
| inverse semimajor axis [10-6 au-1] | 91.62 | ± 2.16 |
| Epoch (TT) | 16950405 | |
| time of perihelion passage (TT) | 20101109.124557 | ± 0.008299 |
| perihelion distance | 9.88300606 | ± 0.00003365 |
| eccentricity | 0.99829287 | ± 0.00002097 |
| argument of perihelion [deg] | 121.740818 | ± 0.000362 |
| longitude of the ascending node [deg] | 38.303509 | ± 0.000041 |
| inclination [deg] | 102.596709 | ± 0.000035 |
| inverse semimajor axis [10-6 au-1] | 172.73 | ± 2.12 |
| Epoch (TT) | 23250712 | |
| time of perihelion passage (TT) | 20101110.587990 | ± 0.008298 |
| perihelion distance | 9.88685045 | ± 0.00003359 |
| eccentricity | 0.99902211 | ± 0.00002095 |
| argument of perihelion [deg] | 121.787706 | ± 0.000362 |
| longitude of the ascending node [deg] | 38.299791 | ± 0.000041 |
| inclination [deg] | 102.577822 | ± 0.000035 |
| inverse semimajor axis [10-6 au-1] | 98.91 | ± 2.12 |