| Solar System Dynamics & Planetology Group |
|
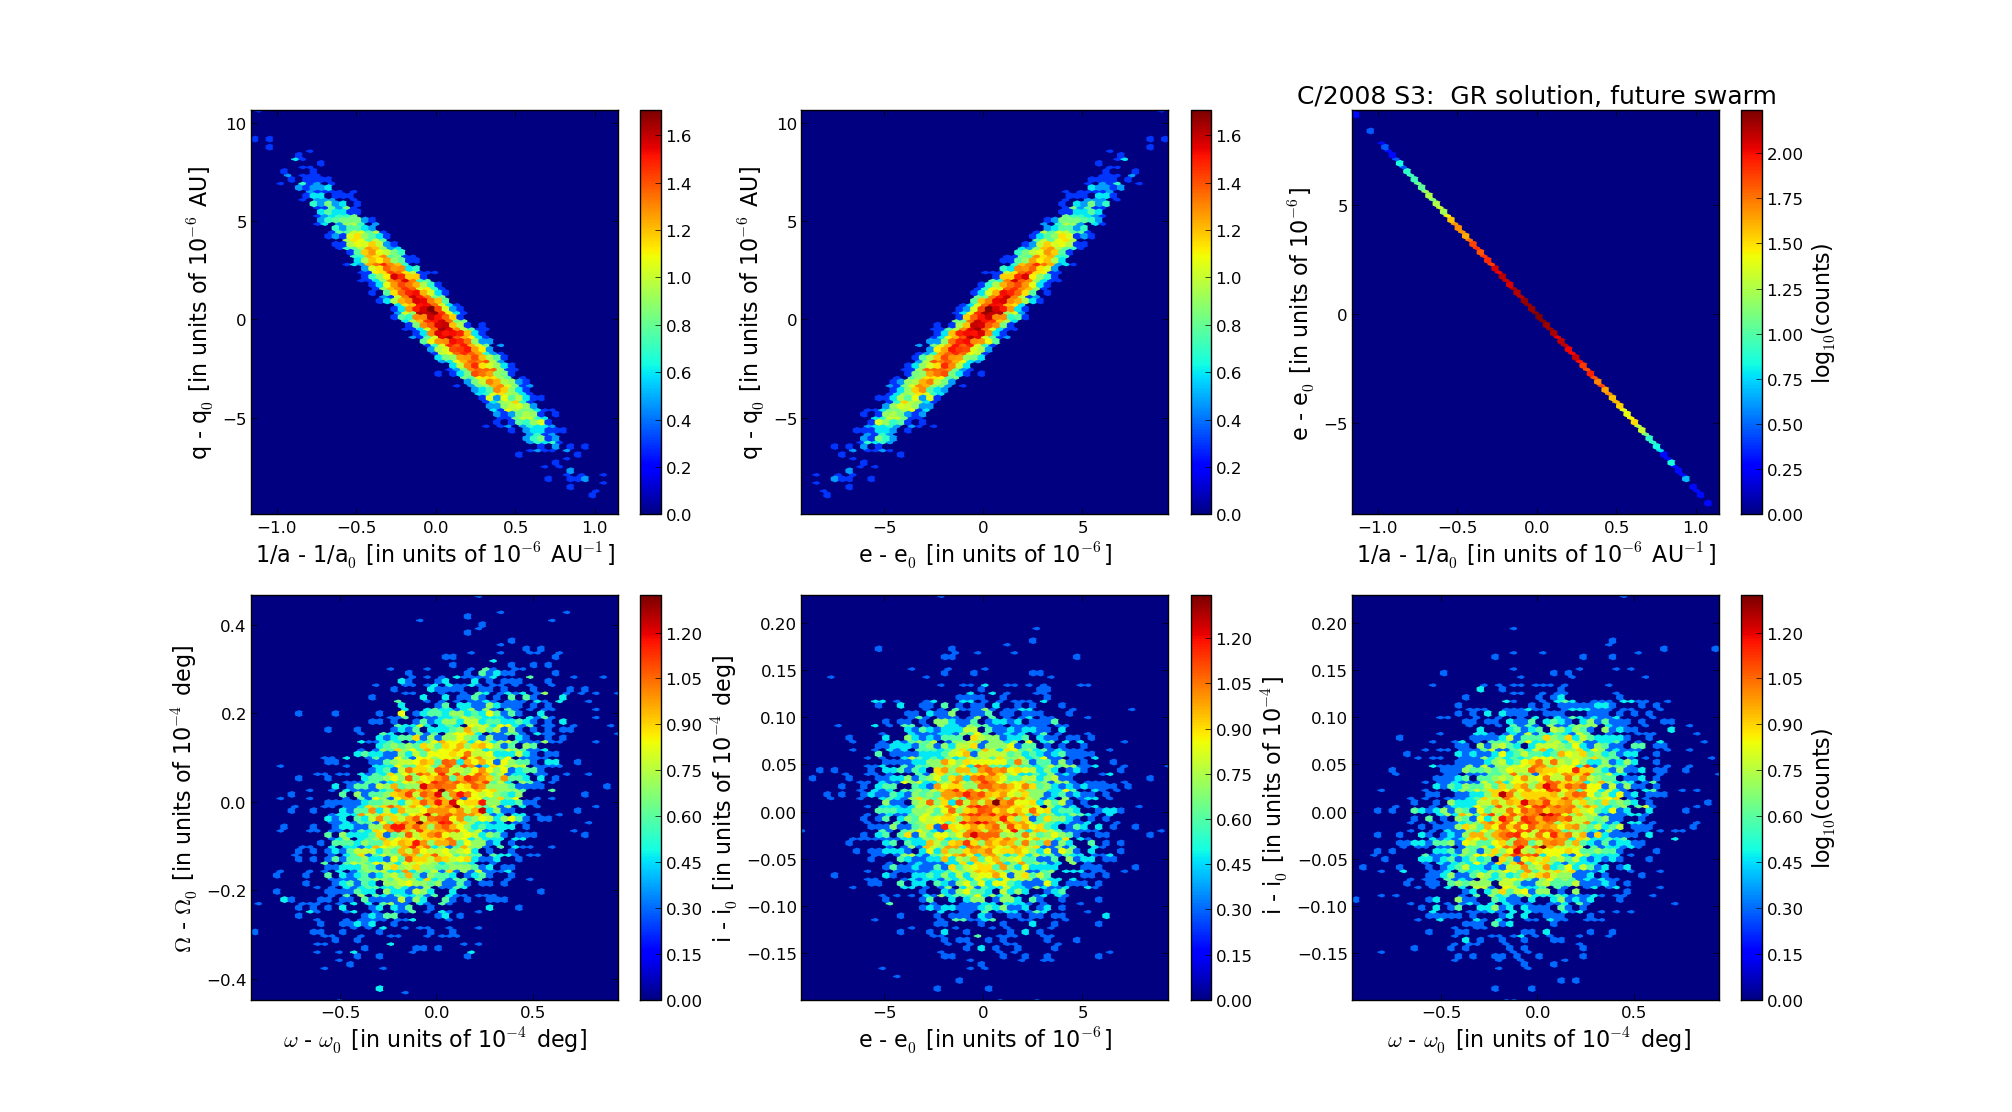
C/2008 S3 Boattini | |
| Solar System Dynamics & Planetology Group |
|
C/2008 S3 Boattini | |
| number of observations | 1953 |
| number of residuals | 3888 |
| data interval | 2006 Dec. 27 — 2015 July 17 |
| rms [arcsec] | 0.42 |
| orbit quality class | 1a+ |
| Epoch (TT) | 20060627.0 | = JD 2453913.5 |
| time of perihelion passage (TT) | 20110603.770782 | ± 0.000415 |
| perihelion distance | 8.01530277 | ± 0.00000267 |
| eccentricity | 1.00360318 | ± 0.00000250 |
| argument of perihelion [deg] | 39.796141 | ± 0.000025 |
| longitude of the ascending node [deg] | 54.922655 | ± 0.000012 |
| inclination [deg] | 162.717969 | ± 0.000005 |
| inverse semimajor axis [10-6 au-1] | -449.54 | ± 0.31 |
| Nongravitational parameters [10-8 au/day2] | A1 = 685.490 ± 45.424 | A2 = -221.870 ± 89.191 | A3 = -172.210 ± 18.419 |

| Epoch (TT) | 17001029 | |
| time of perihelion passage (TT) | 20110607.455076 | ± 0.000424 |
| perihelion distance | 8.01572739 | ± 0.00000262 |
| eccentricity | 0.99983185 | ± 0.00000246 |
| argument of perihelion [deg] | 39.923318 | ± 0.000025 |
| longitude of the ascending node [deg] | 54.933200 | ± 0.000012 |
| inclination [deg] | 162.705580 | ± 0.000005 |
| inverse semimajor axis [10-6 au-1] | 20.98 | ± 0.31 |
| Epoch (TT) | 23220211 | |
| time of perihelion passage (TT) | 20110607.066649 | ± 0.000418 |
| perihelion distance | 8.01508717 | ± 0.00000267 |
| eccentricity | 0.99973828 | ± 0.00000246 |
| argument of perihelion [deg] | 40.023286 | ± 0.000026 |
| longitude of the ascending node [deg] | 55.007315 | ± 0.000012 |
| inclination [deg] | 162.706674 | ± 0.000005 |
| inverse semimajor axis [10-6 au-1] | 32.65 | ± 0.31 |
