| Solar System Dynamics & Planetology Group |
|
C/2000 H1 LINEAR | |
| Solar System Dynamics & Planetology Group |
|
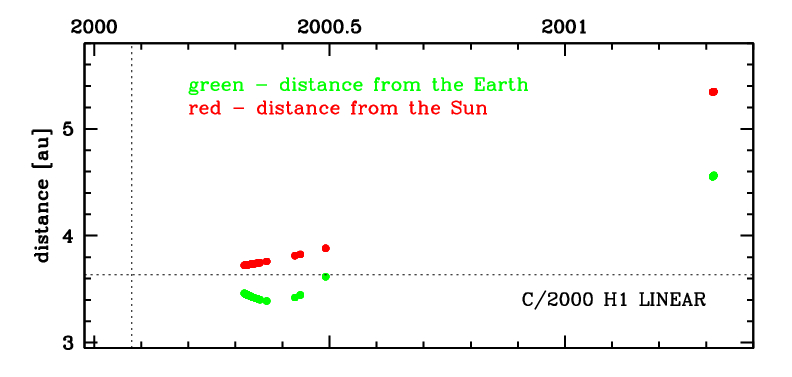
C/2000 H1 LINEAR | |
| number of observations | 116 |
| number of residuals | 228 |
| data interval | 2000 Apr. 26 — 2001 Apr. 25 |
| rms [arcsec] | 0.60 |
| orbit quality class | 2a |
| Epoch (TT) | 20000117.0 | = JD 2451560.5 |
| time of perihelion passage (TT) | 20000129.258233 | ± 0.006807 |
| perihelion distance | 3.63810255 | ± 0.00004586 |
| eccentricity | 1.00177488 | ± 0.00014145 |
| argument of perihelion [deg] | 78.870414 | ± 0.000827 |
| longitude of the ascending node [deg] | 356.439823 | ± 0.000254 |
| inclination [deg] | 118.237137 | ± 0.000108 |
| inverse semimajor axis [10-6 au-1] | -487.86 | ± 38.87 |
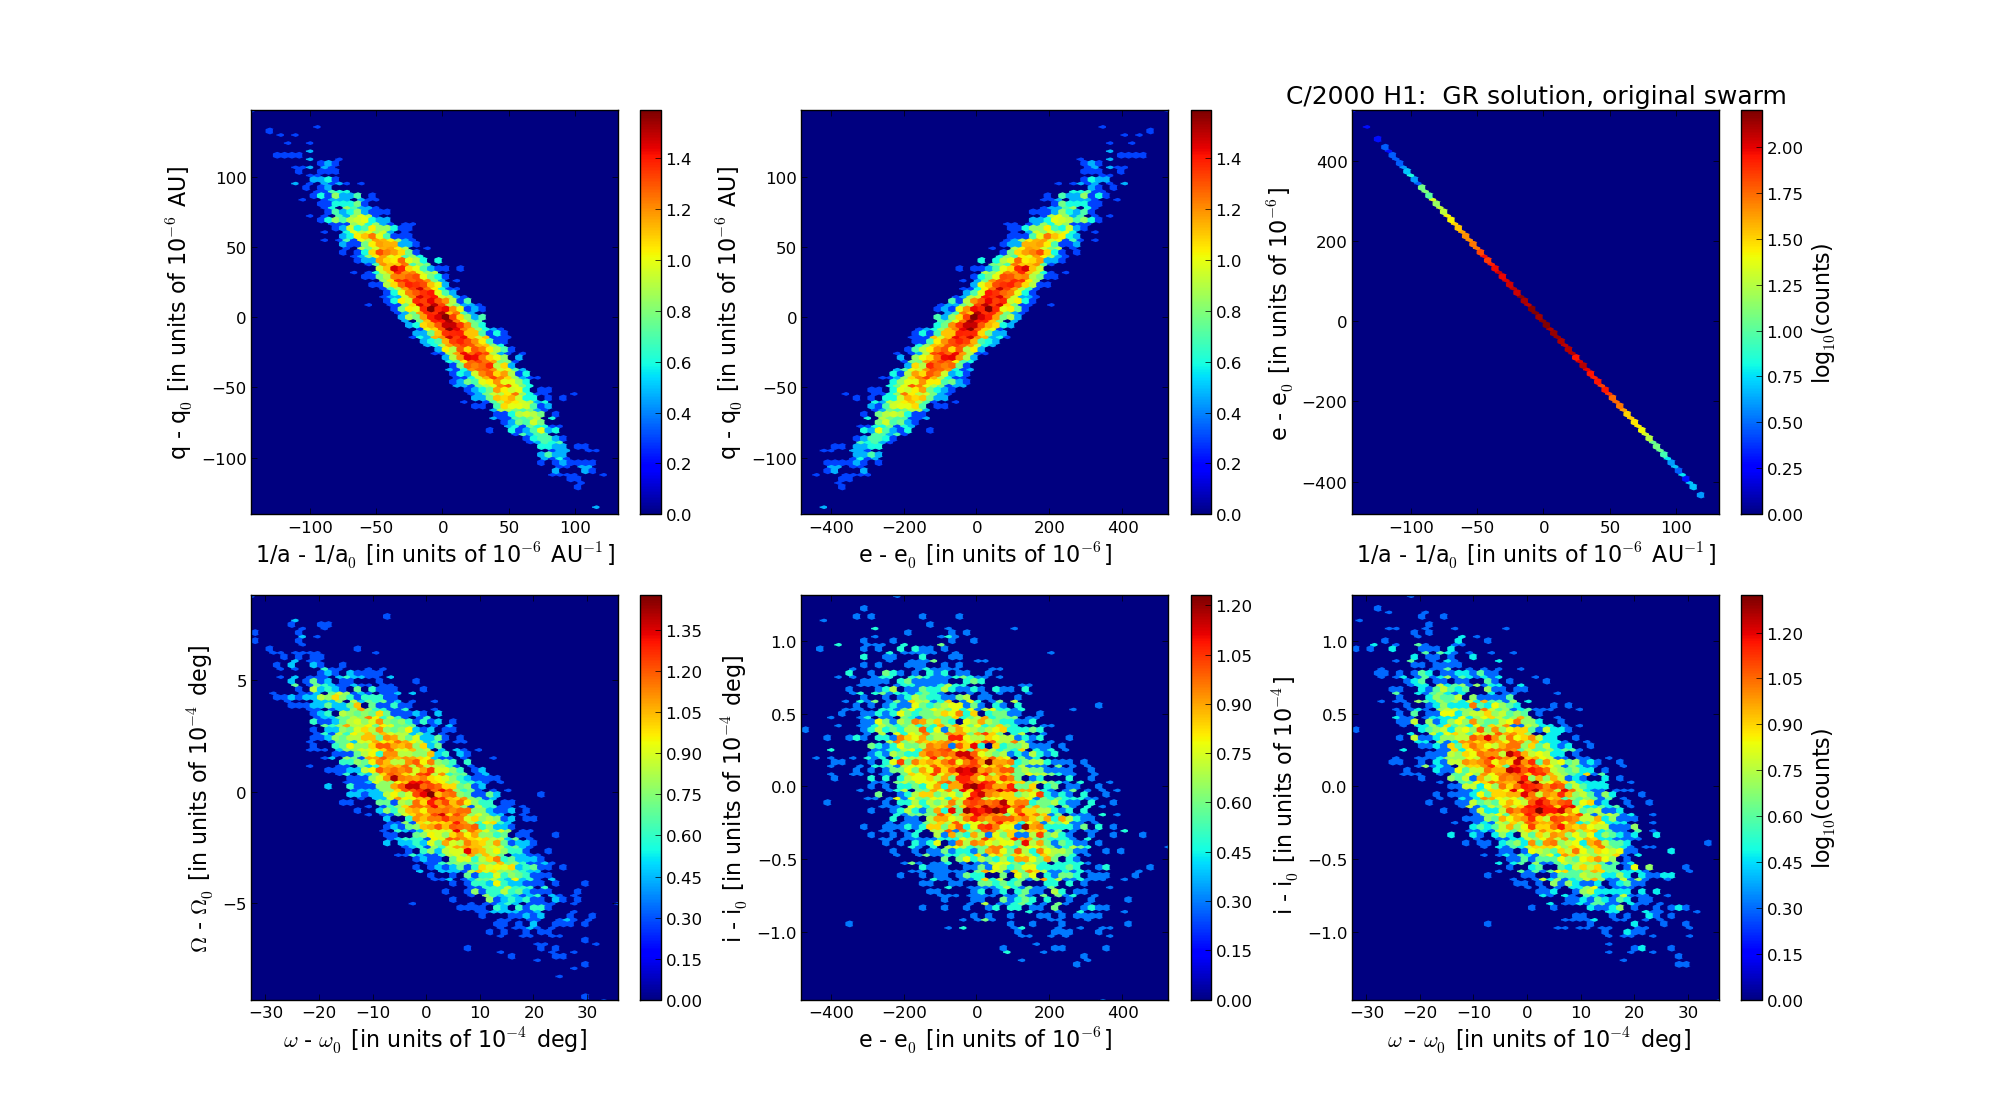
| Epoch (TT) | 16960728 | |
| time of perihelion passage (TT) | 20000126.873179 | ± 0.008108 |
| perihelion distance | 3.64438682 | ± 0.00004065 |
| eccentricity | 0.99978811 | ± 0.00013895 |
| argument of perihelion [deg] | 78.572883 | ± 0.000974 |
| longitude of the ascending node [deg] | 356.430616 | ± 0.000245 |
| inclination [deg] | 118.232361 | ± 0.000038 |
| inverse semimajor axis [10-6 au-1] | 58.14 | ± 38.13 |
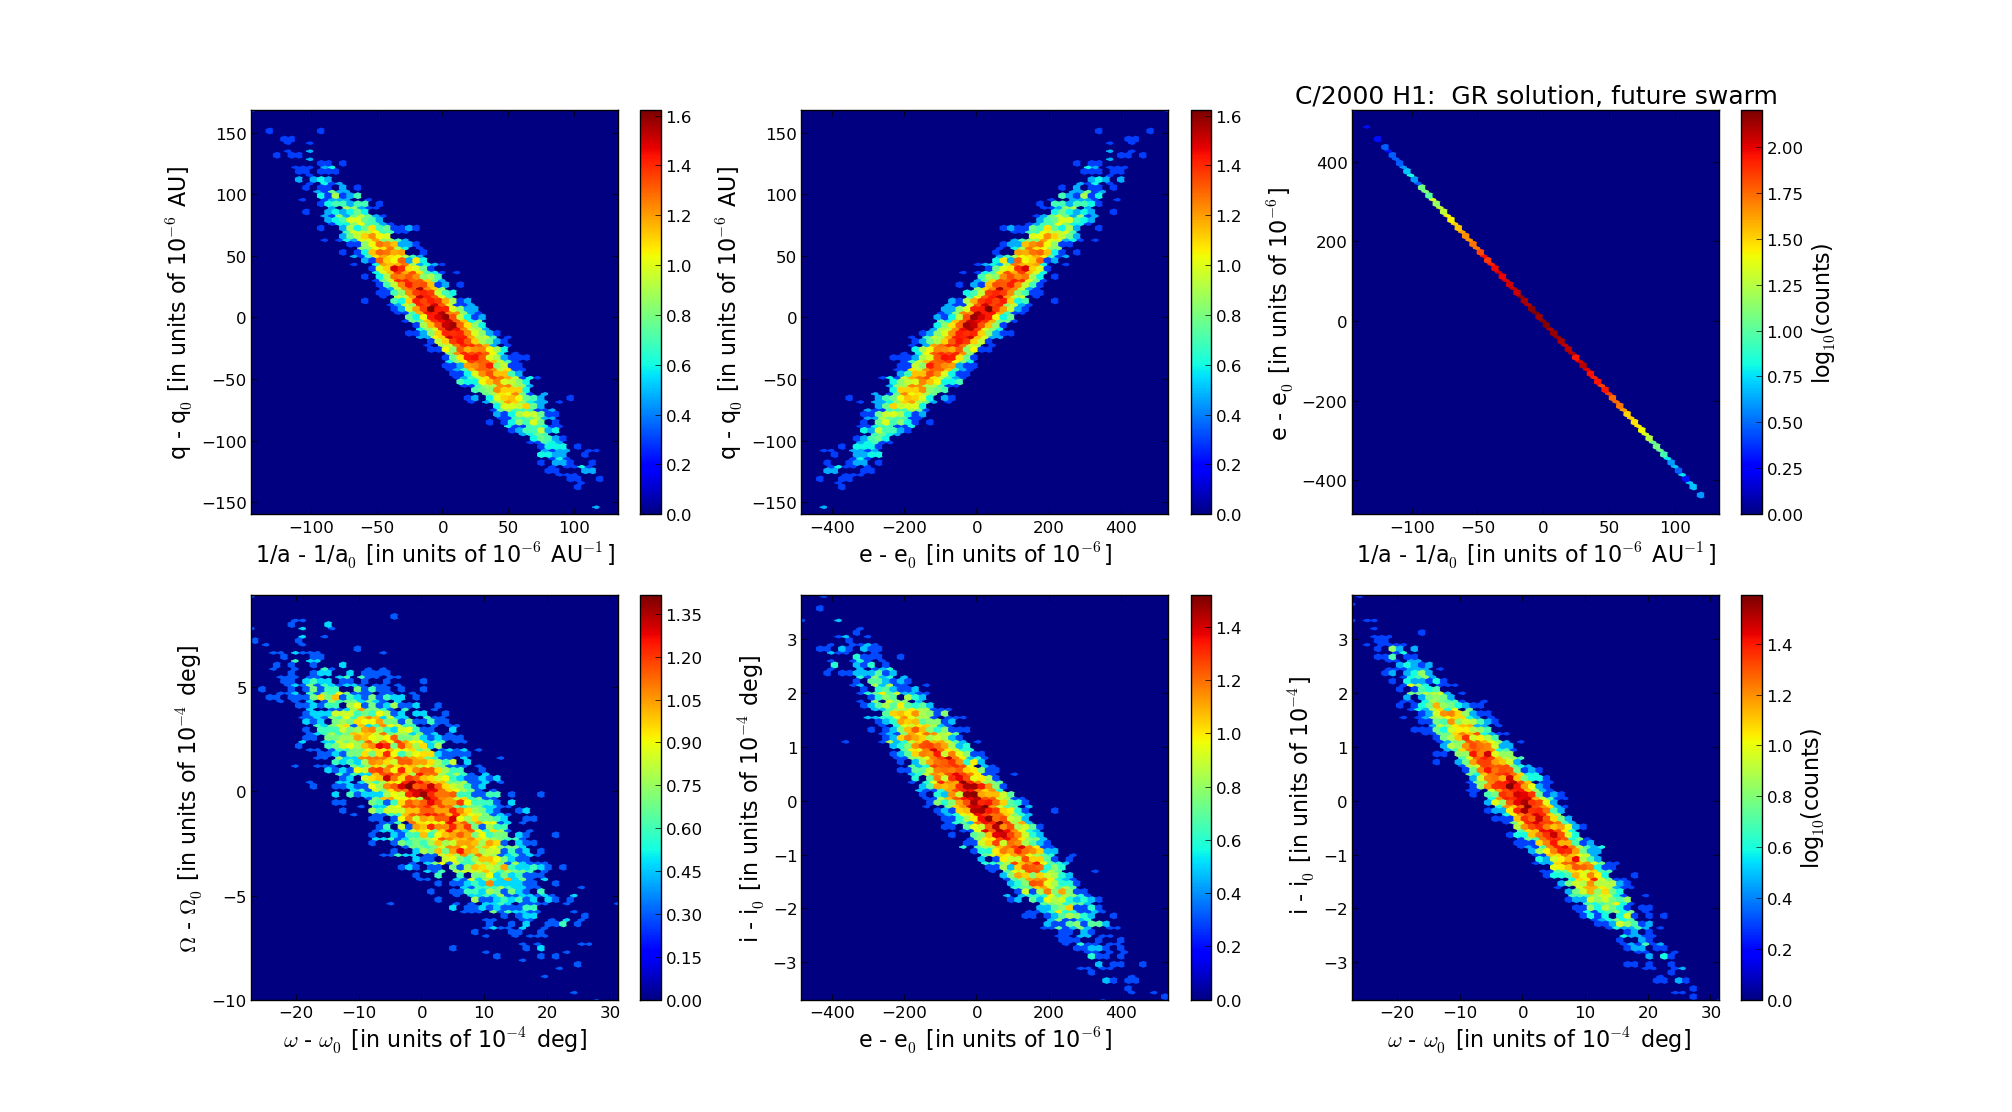
| Epoch (TT) | 23060113 | |
| time of perihelion passage (TT) | 20000128.168006 | ± 0.006351 |
| perihelion distance | 3.63890839 | ± 0.00004619 |
| eccentricity | 0.99901832 | ± 0.00014000 |
| argument of perihelion [deg] | 78.800614 | ± 0.000827 |
| longitude of the ascending node [deg] | 356.501115 | ± 0.000262 |
| inclination [deg] | 118.289374 | ± 0.000111 |
| inverse semimajor axis [10-6 au-1] | 269.77 | ± 38.48 |