| Solar System Dynamics & Planetology Group |
|
C/1998 M3 Larsen | |
| Solar System Dynamics & Planetology Group |
|
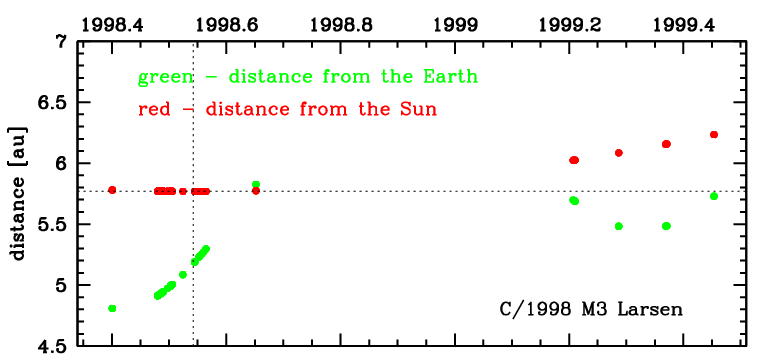
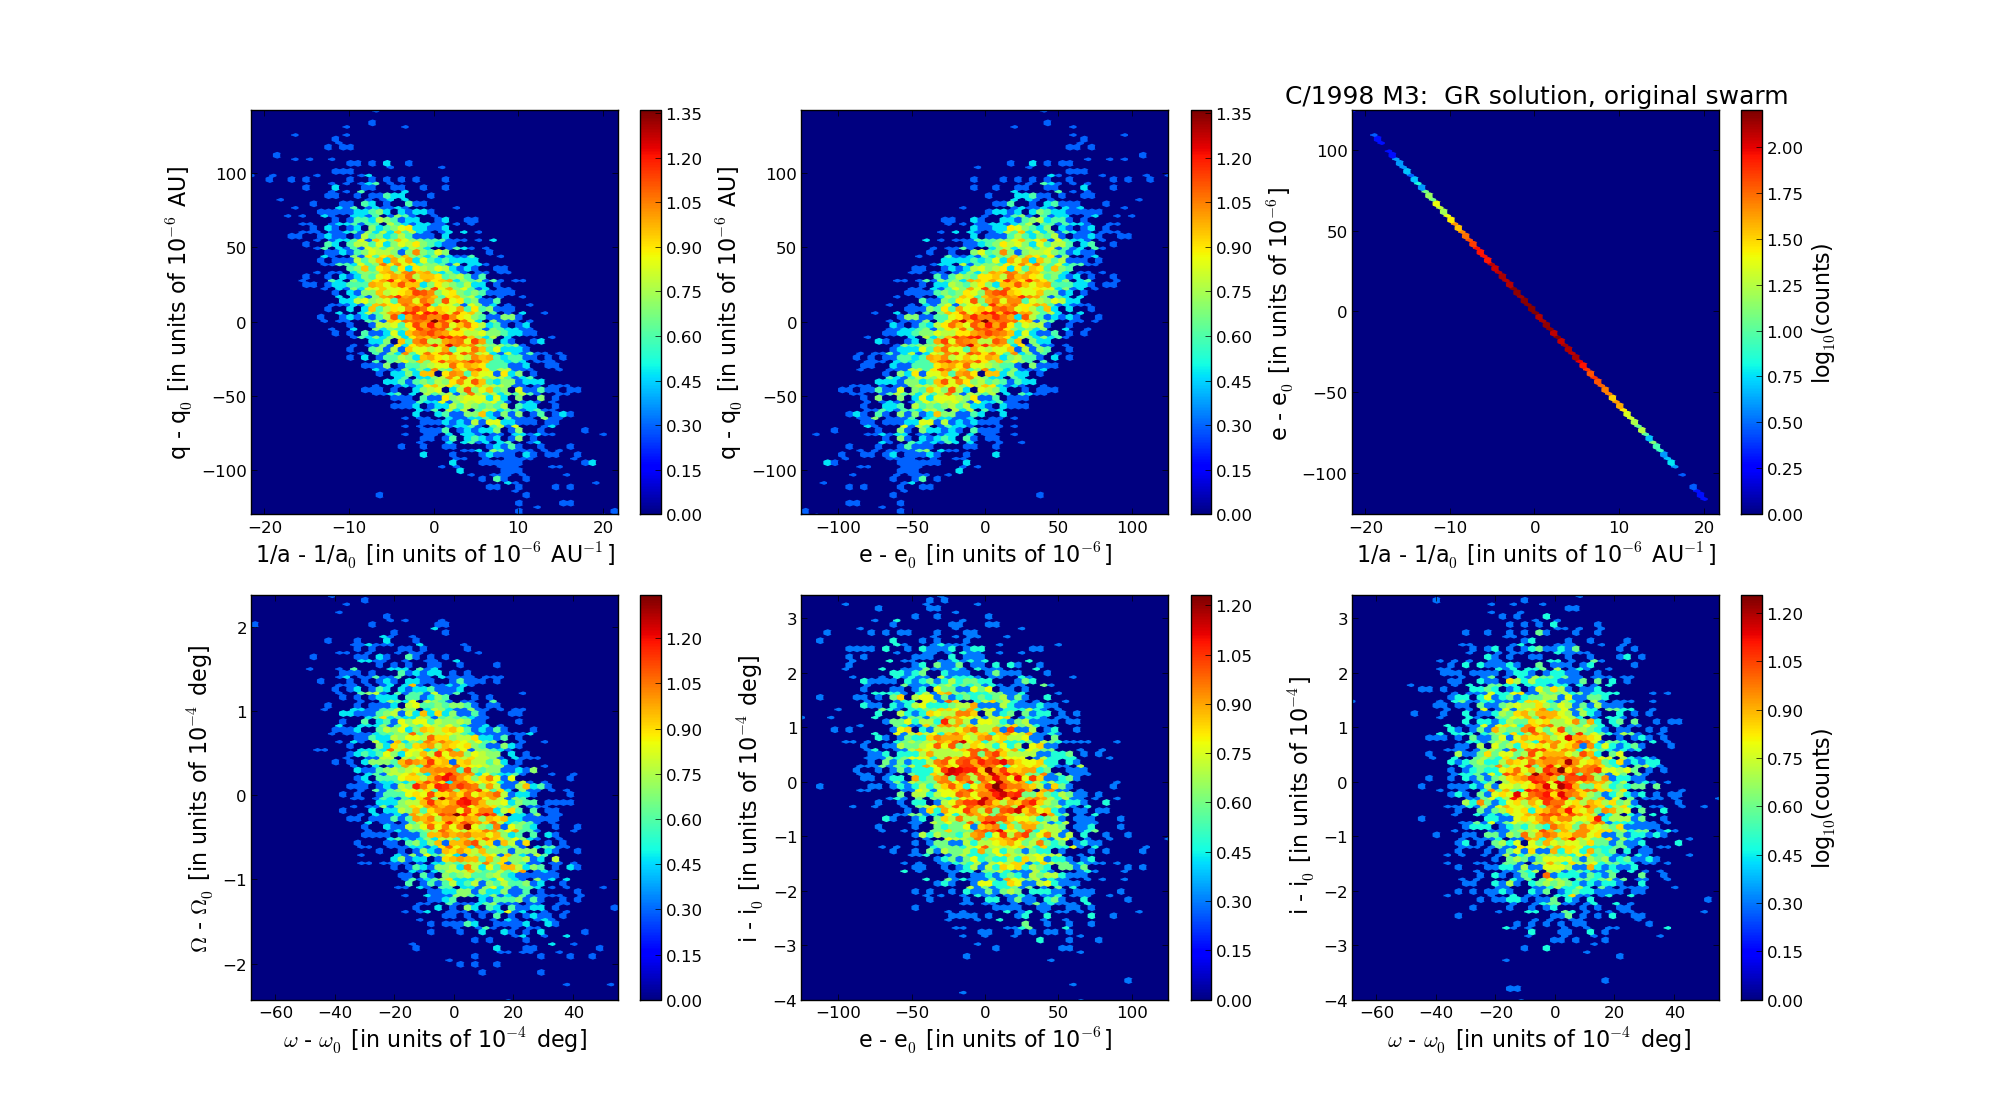
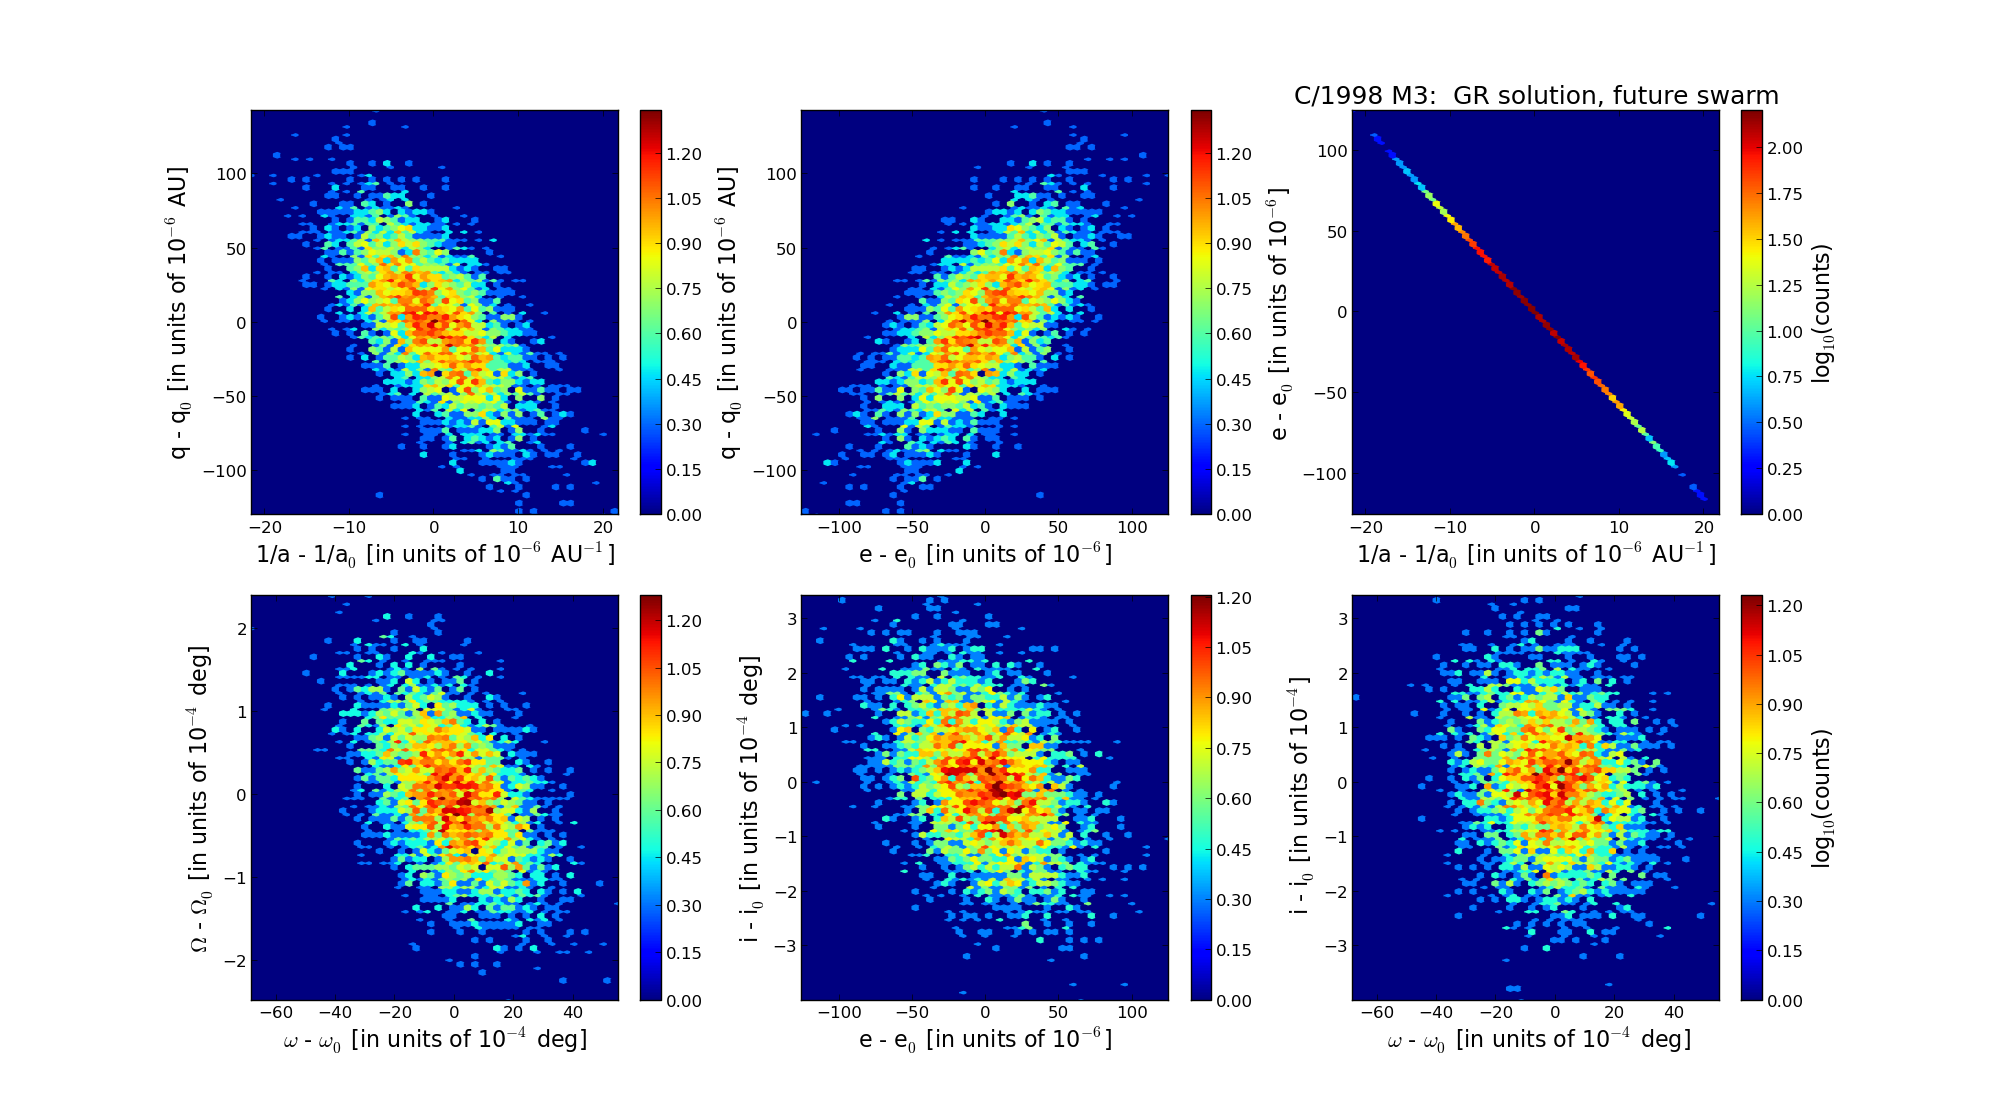
C/1998 M3 Larsen | |
| number of observations | 110 |
| number of residuals | 219 |
| data interval | 1998 May 26 — 1999 June 14 |
| rms [arcsec] | 0.66 |
| orbit quality class | 1b |
| Epoch (TT) | 19980706.0 | = JD 2451000.5 |
| time of perihelion passage (TT) | 19980717.141592 | ± 0.014729 |
| perihelion distance | 5.76830630 | ± 0.00004016 |
| eccentricity | 1.00222152 | ± 0.00003287 |
| argument of perihelion [deg] | 20.840919 | ± 0.001485 |
| longitude of the ascending node [deg] | 255.525387 | ± 0.000071 |
| inclination [deg] | 113.420178 | ± 0.000108 |
| inverse semimajor axis [10-6 au-1] | -385.12 | ± 5.69 |
| Epoch (TT) | 16900501 | |
| time of perihelion passage (TT) | 19980715.793281 | ± 0.014631 |
| perihelion distance | 5.76636919 | ± 0.00003991 |
| eccentricity | 0.99916618 | ± 0.00003250 |
| argument of perihelion [deg] | 20.763331 | ± 0.001477 |
| longitude of the ascending node [deg] | 255.435959 | ± 0.000071 |
| inclination [deg] | 113.433778 | ± 0.000109 |
| inverse semimajor axis [10-6 au-1] | 144.60 | ± 5.64 |
| Epoch (TT) | 23070617 | |
| time of perihelion passage (TT) | 19980715.578880 | ± 0.014663 |
| perihelion distance | 5.77023651 | ± 0.00003995 |
| eccentricity | 0.99881653 | ± 0.00003252 |
| argument of perihelion [deg] | 20.705550 | ± 0.001480 |
| longitude of the ascending node [deg] | 255.482996 | ± 0.000071 |
| inclination [deg] | 113.451985 | ± 0.000109 |
| inverse semimajor axis [10-6 au-1] | 205.10 | ± 5.64 |