| Solar System Dynamics & Planetology Group |
|
C/1960 M1 Humason | |
| Solar System Dynamics & Planetology Group |
|
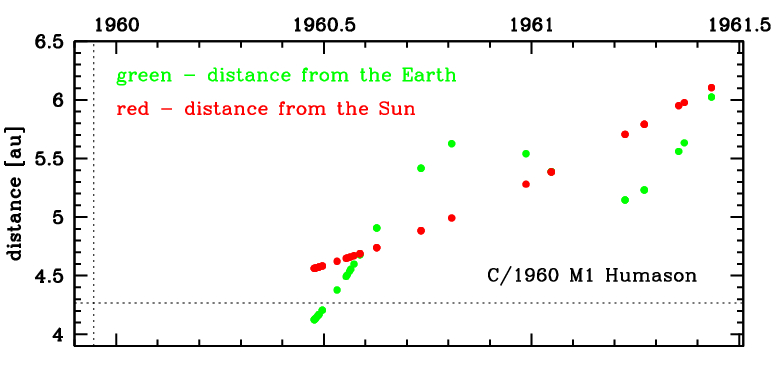
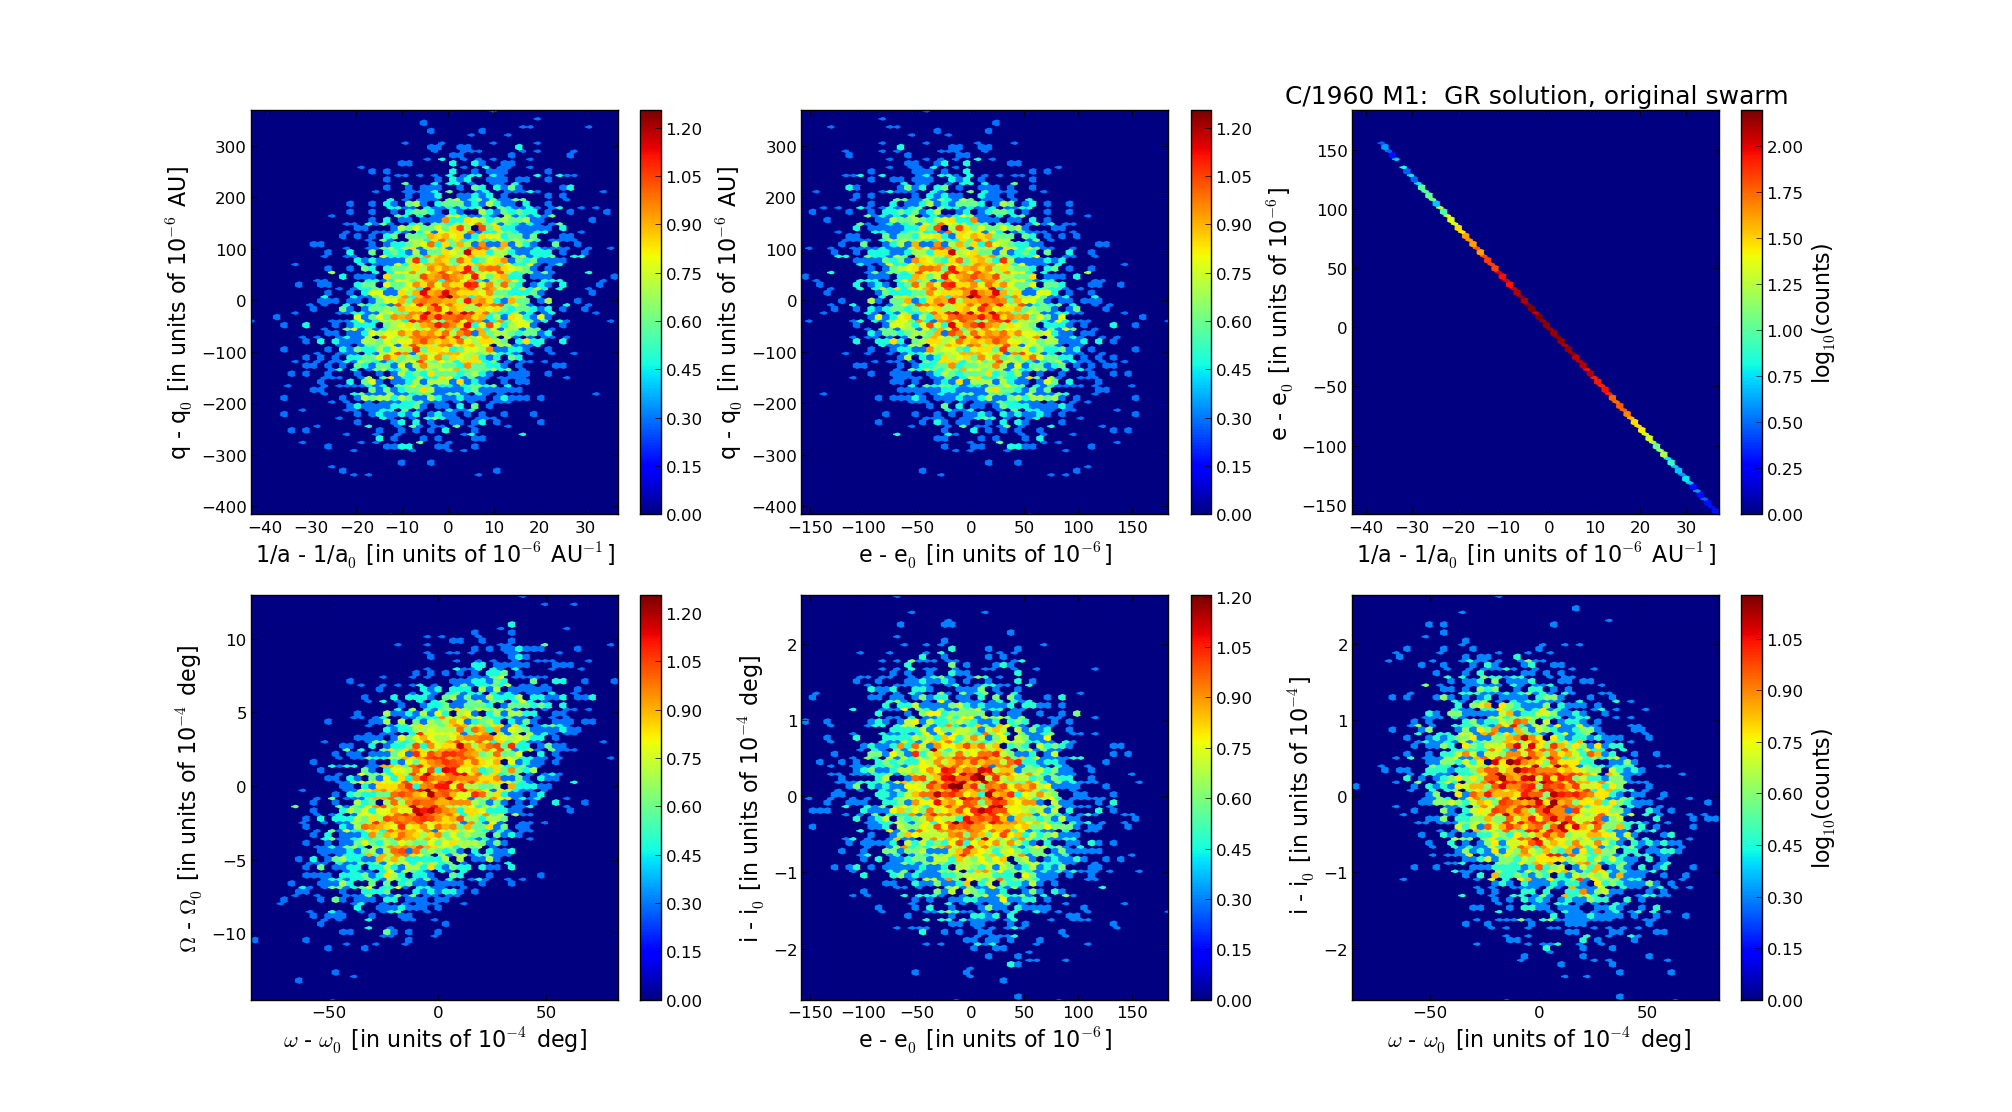
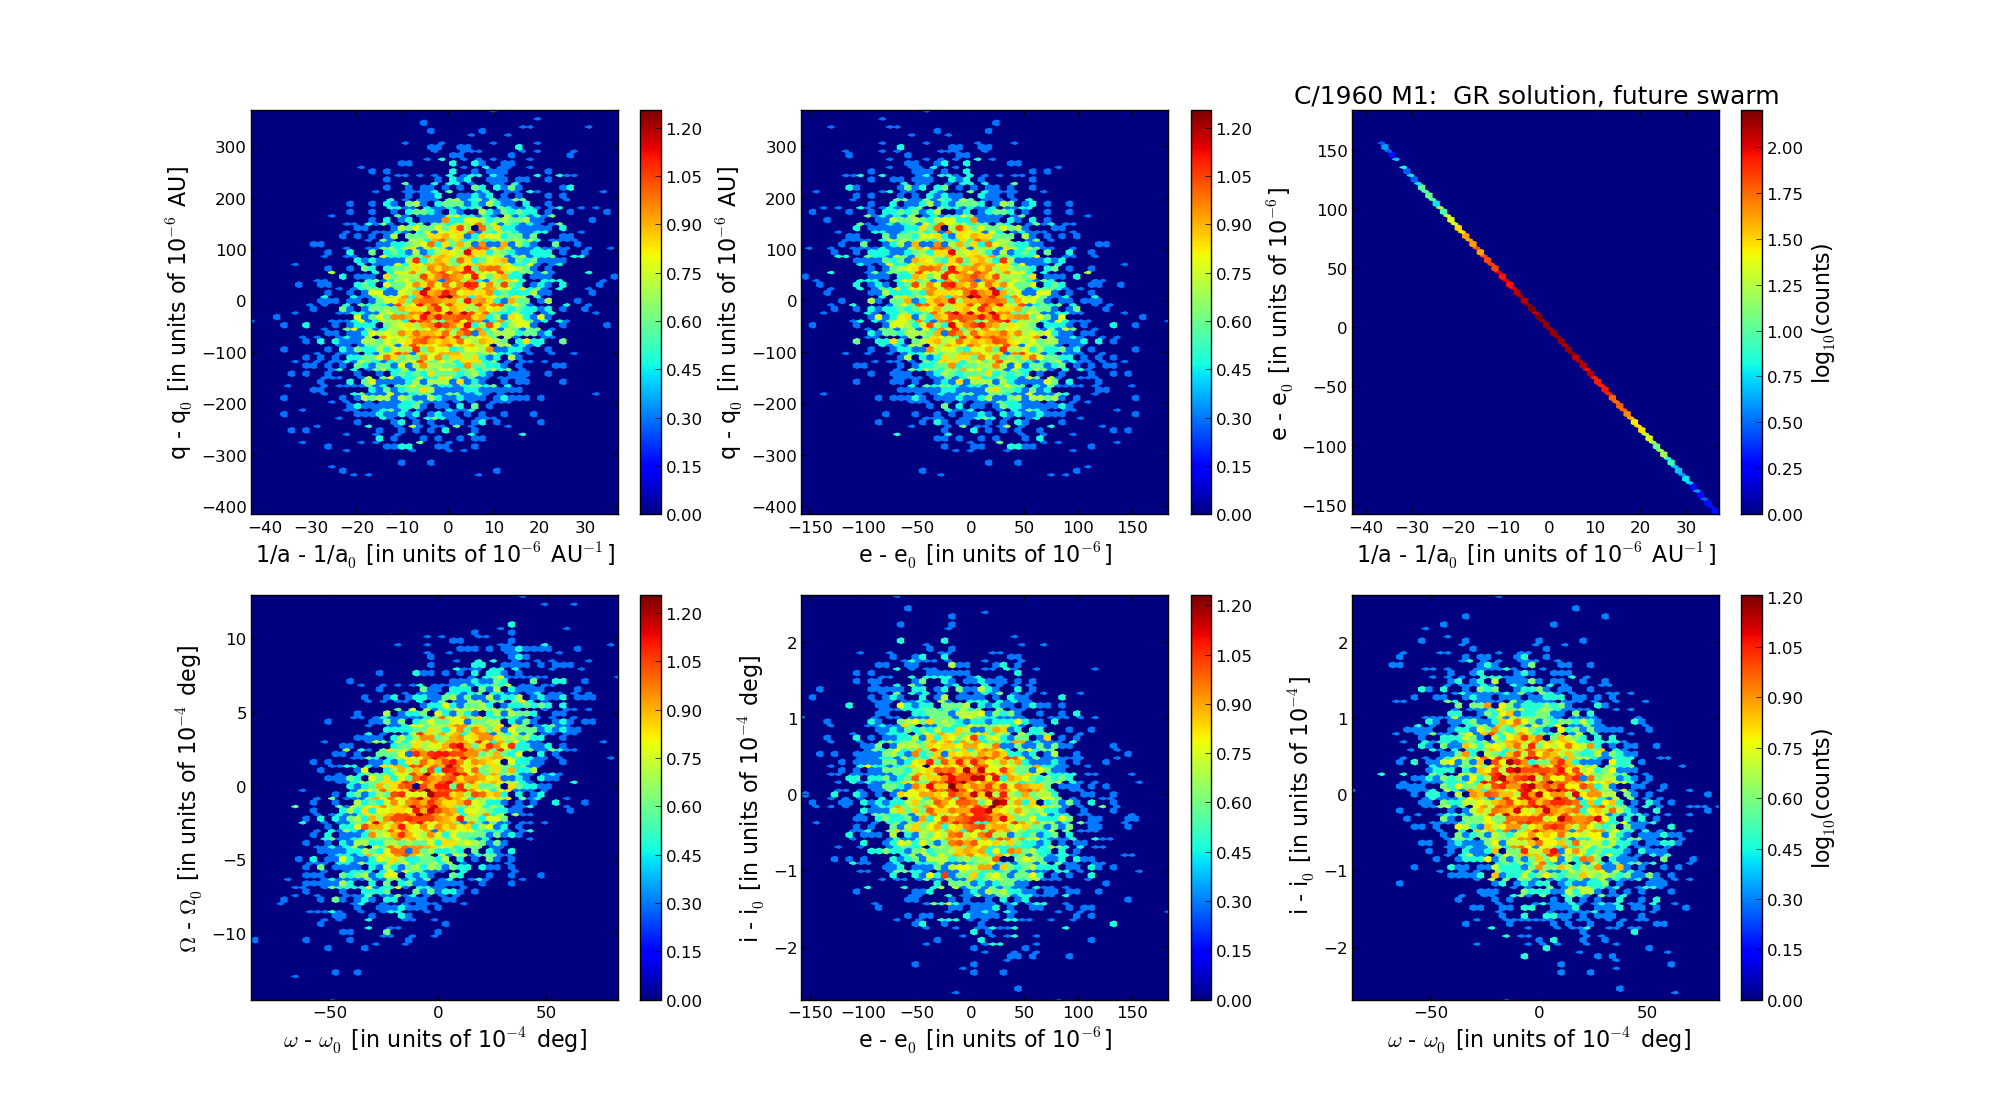
C/1960 M1 Humason | |
| number of observations | 34 |
| number of residuals | 65 |
| data interval | 1960 June 23 — 1961 June 7 |
| rms [arcsec] | 1.42 |
| orbit quality class | 1b |
| Epoch (TT) | 19591218.0 | = JD 2436920.5 |
| time of perihelion passage (TT) | 19591211.210719 | ± 0.007331 |
| perihelion distance | 4.26702674 | ± 0.00011122 |
| eccentricity | 1.00087137 | ± 0.00004611 |
| argument of perihelion [deg] | 46.462683 | ± 0.002369 |
| longitude of the ascending node [deg] | 307.261873 | ± 0.000372 |
| inclination [deg] | 125.469473 | ± 0.000071 |
| inverse semimajor axis [10-6 au-1] | -204.21 | ± 10.81 |
| Epoch (TT) | 16550813 | |
| time of perihelion passage (TT) | 19591211.632991 | ± 0.007317 |
| perihelion distance | 4.25879346 | ± 0.00011012 |
| eccentricity | 0.99981811 | ± 0.00004674 |
| argument of perihelion [deg] | 46.624560 | ± 0.002348 |
| longitude of the ascending node [deg] | 307.313828 | ± 0.000366 |
| inclination [deg] | 125.469073 | ± 0.000072 |
| inverse semimajor axis [10-6 au-1] | 42.71 | ± 10.97 |
| Epoch (TT) | 22631005 | |
| time of perihelion passage (TT) | 19591210.688548 | ± 0.007319 |
| perihelion distance | 4.26090377 | ± 0.00011035 |
| eccentricity | 0.99999666 | ± 0.00004676 |
| argument of perihelion [deg] | 46.426637 | ± 0.002351 |
| longitude of the ascending node [deg] | 307.326242 | ± 0.000366 |
| inclination [deg] | 125.428964 | ± 0.000071 |
| inverse semimajor axis [10-6 au-1] | 0.78 | ± 10.97 |