| Solar System Dynamics & Planetology Group |
|
C/1948 T1 Wirtanen | |
| Solar System Dynamics & Planetology Group |
|
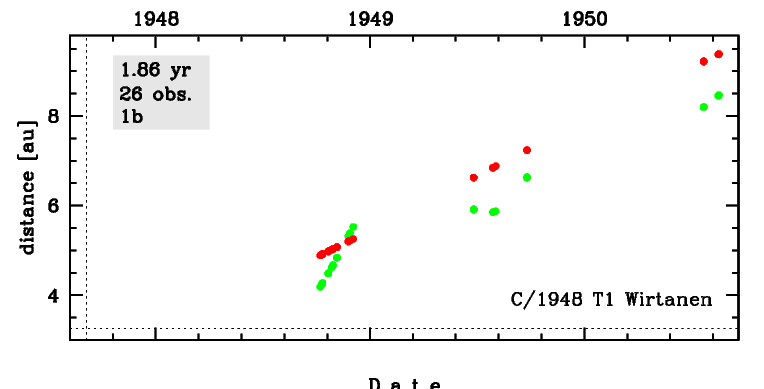
C/1948 T1 Wirtanen | |
| number of observations | 26 |
| number of residuals | 52 |
| data interval | 1948 Oct. 7 — 1950 Aug. 17 |
| rms [arcsec] | 0.94 |
| orbit quality class | 1b |
| Epoch (TT) | 19470912.0 | = JD 2432440.5 |
| time of perihelion passage (TT) | 19470904.429515 | ± 0.010323 |
| perihelion distance | 3.26110877 | ± 0.00011350 |
| eccentricity | 1.00227683 | ± 0.00003289 |
| argument of perihelion [deg] | 73.464822 | ± 0.001866 |
| longitude of the ascending node [deg] | 122.120668 | ± 0.000217 |
| inclination [deg] | 155.077948 | ± 0.000265 |
| inverse semimajor axis [10-6 au-1] | -698.18 | ± 10.07 |
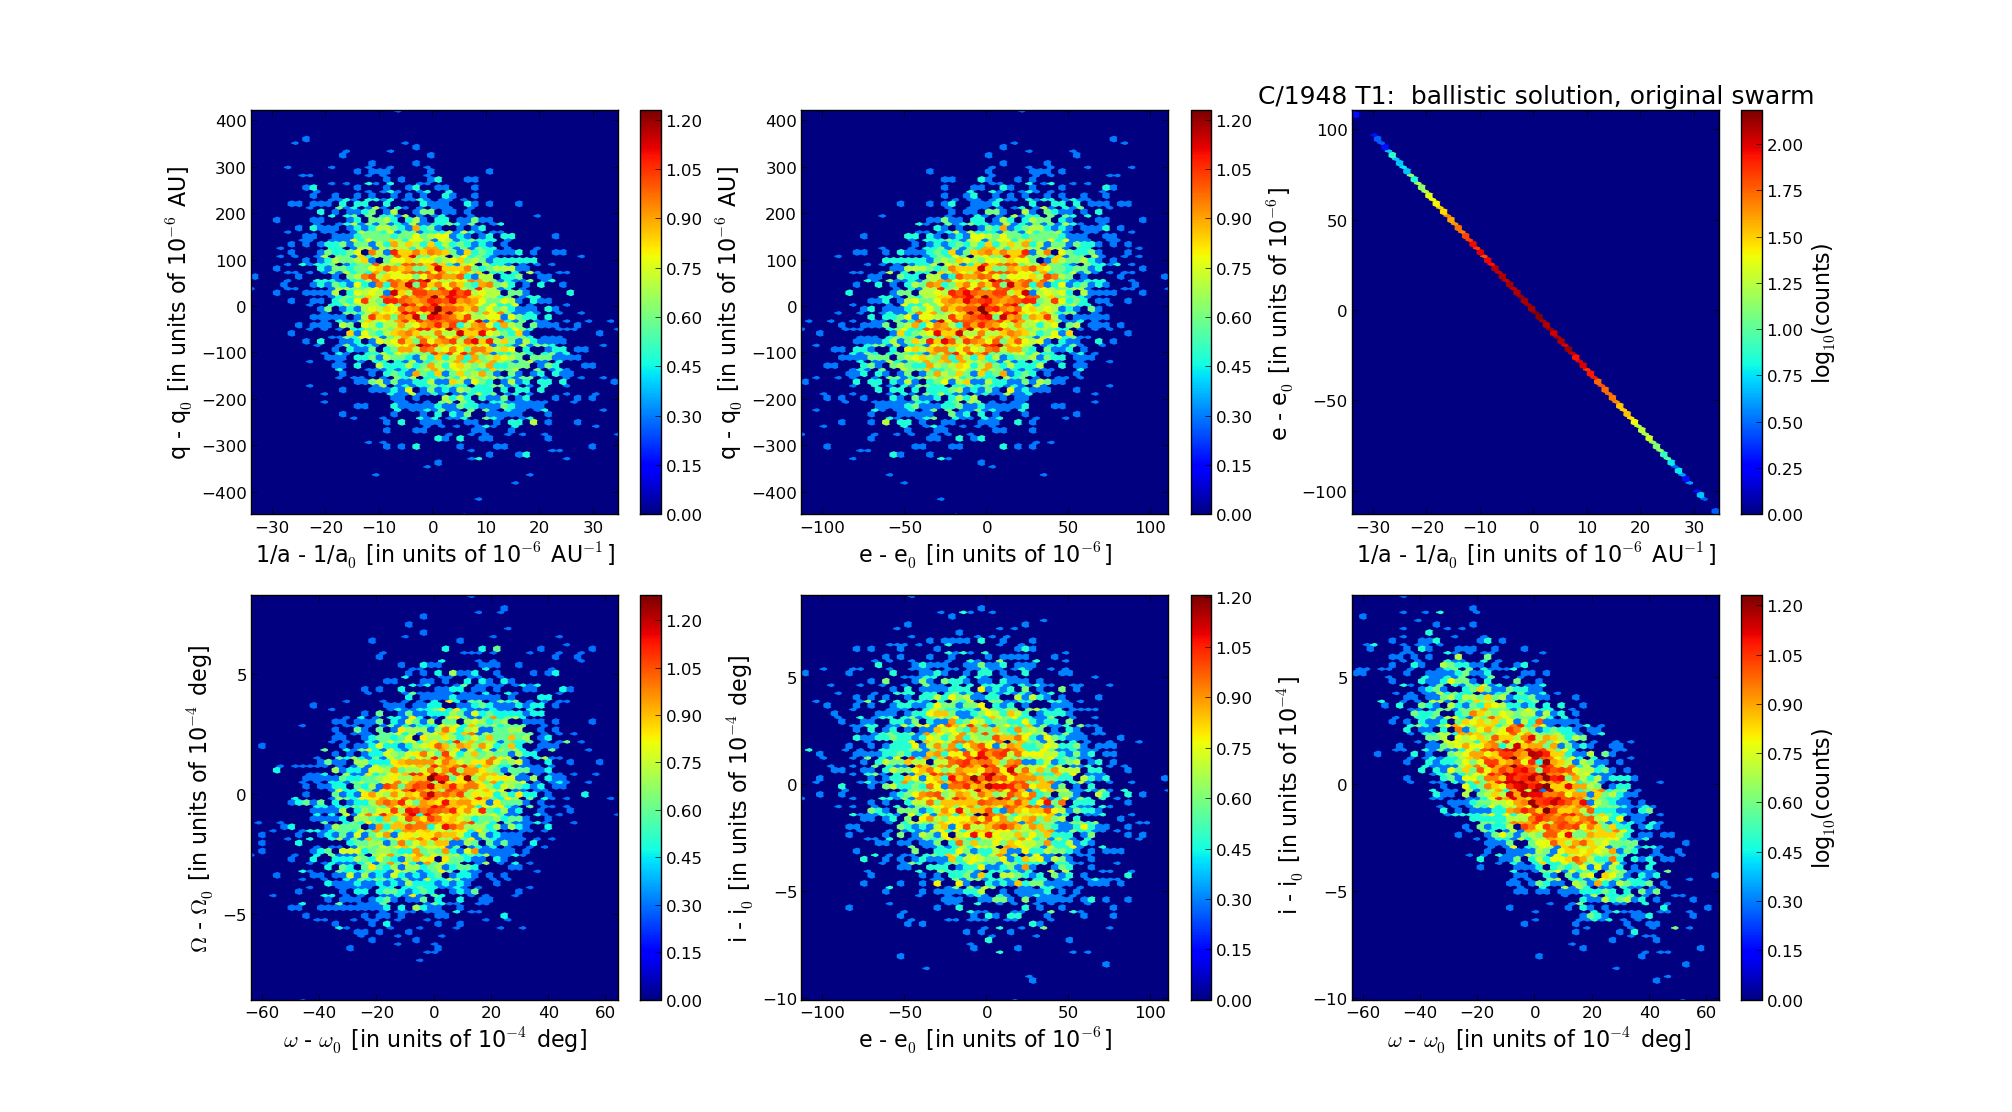
| Epoch (TT) | 16450206 | |
| time of perihelion passage (TT) | 19470903.743055 | ± 0.010324 |
| perihelion distance | 3.26052435 | ± 0.00011079 |
| eccentricity | 0.99988853 | ± 0.00003277 |
| argument of perihelion [deg] | 73.395315 | ± 0.001840 |
| longitude of the ascending node [deg] | 121.990438 | ± 0.000217 |
| inclination [deg] | 155.123775 | ± 0.000260 |
| inverse semimajor axis [10-6 au-1] | 34.19 | ± 10.05 |
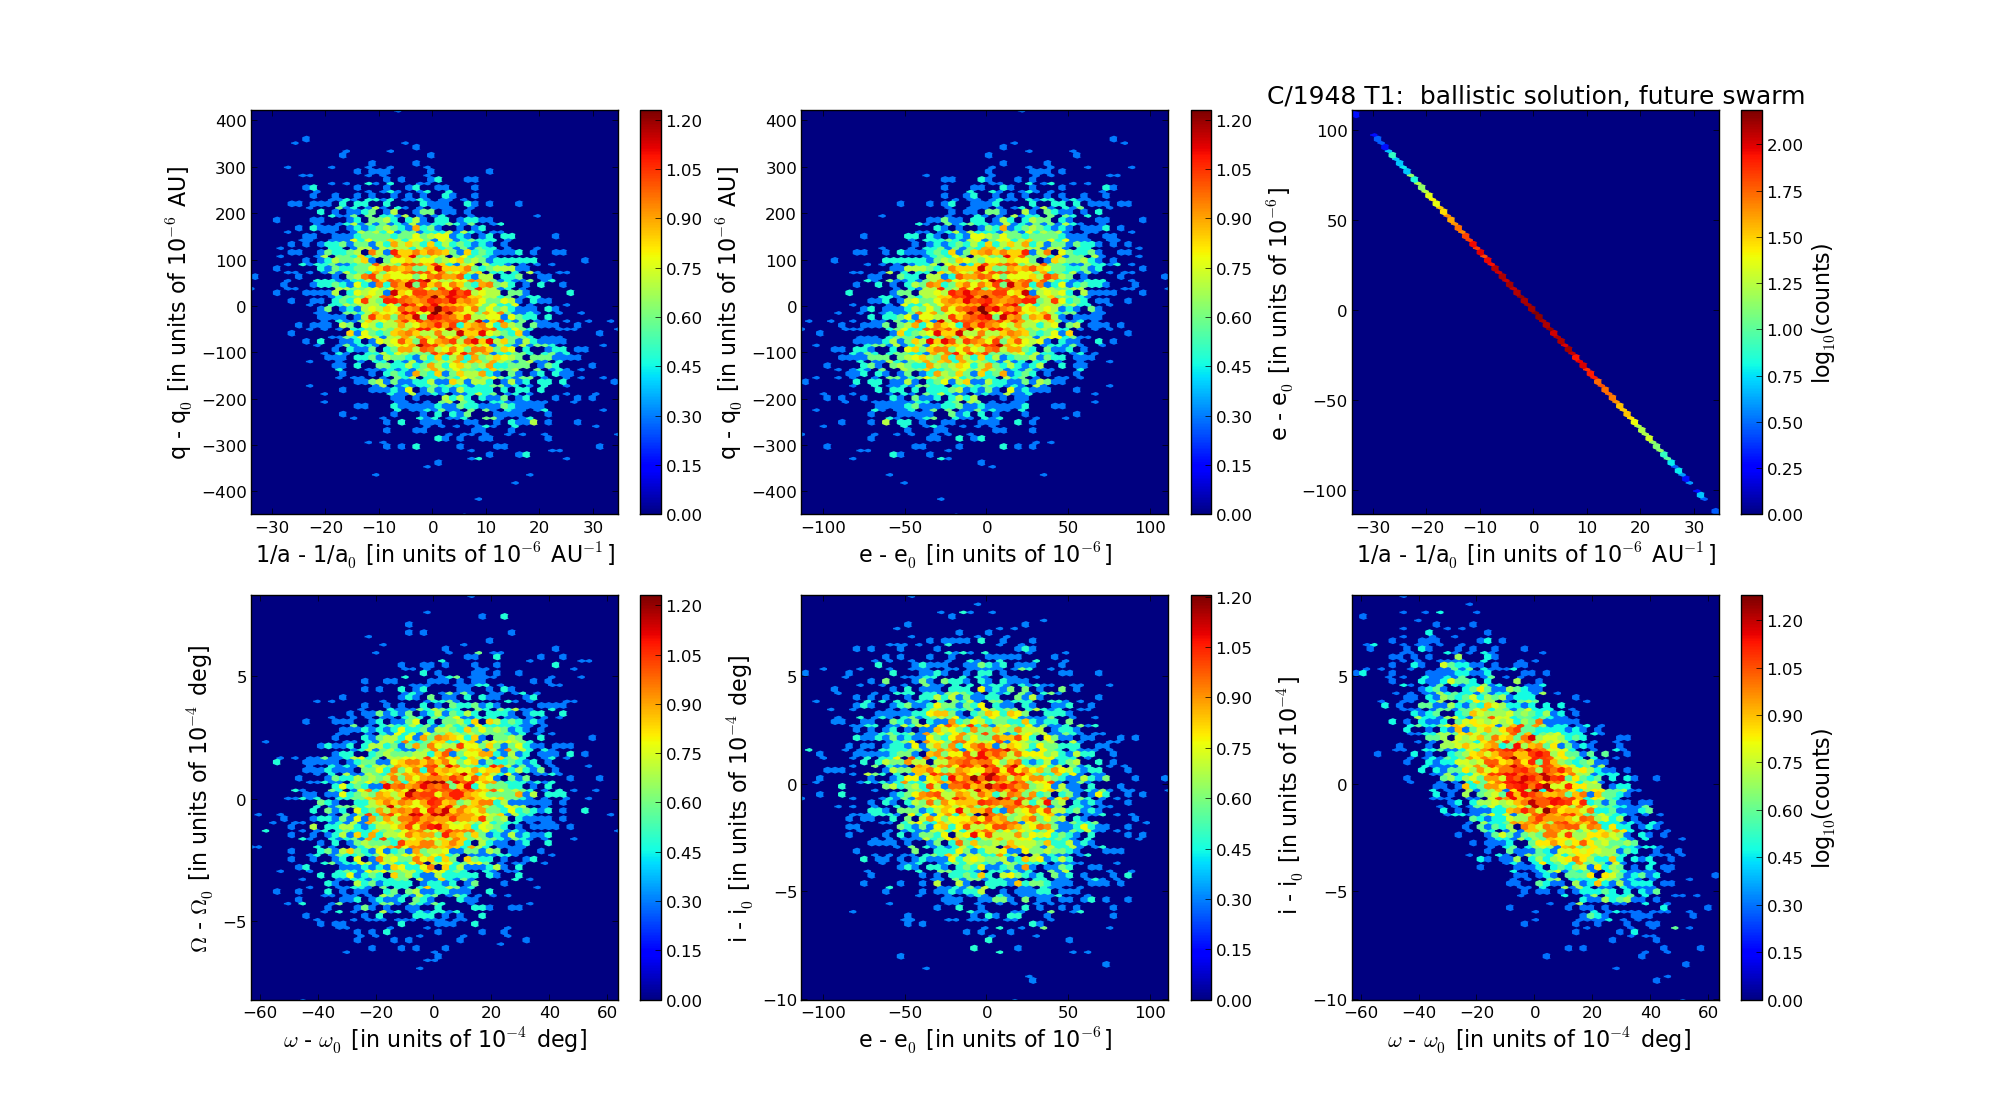
| Epoch (TT) | 22520624 | |
| time of perihelion passage (TT) | 19470903.674841 | ± 0.010358 |
| perihelion distance | 3.27021985 | ± 0.00011087 |
| eccentricity | 0.99926416 | ± 0.00003285 |
| argument of perihelion [deg] | 73.548717 | ± 0.001821 |
| longitude of the ascending node [deg] | 122.147554 | ± 0.000214 |
| inclination [deg] | 155.105084 | ± 0.000259 |
| inverse semimajor axis [10-6 au-1] | 225.01 | ± 10.05 |