| Solar System Dynamics & Planetology Group |
|
C/1947 Y1 Mrkos | |
| Solar System Dynamics & Planetology Group |
|
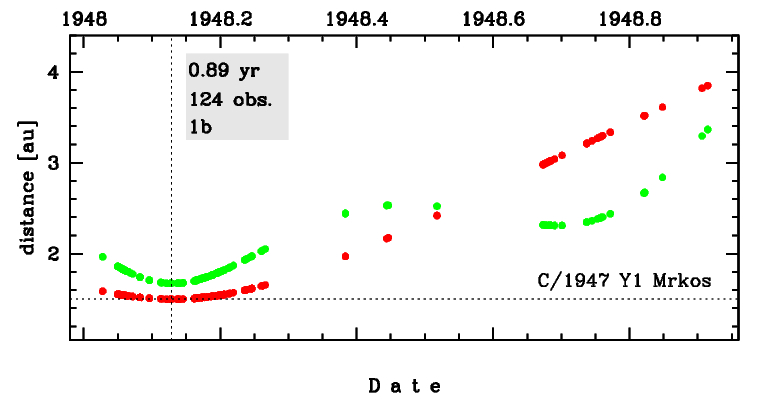
C/1947 Y1 Mrkos | |
| number of observations | 124 |
| number of residuals | 204 |
| data interval | 1948 Jan. 10 — 1948 Nov. 30 |
| rms [arcsec] | 1.22 |
| orbit quality class | 1b |
| Epoch (TT) | 19480219.0 | = JD 2432600.5 |
| time of perihelion passage (TT) | 19480216.691915 | ± 0.000266 |
| perihelion distance | 1.49955491 | ± 0.00000327 |
| eccentricity | 1.00108229 | ± 0.00001286 |
| argument of perihelion [deg] | 61.923925 | ± 0.000215 |
| longitude of the ascending node [deg] | 199.300972 | ± 0.000072 |
| inclination [deg] | 77.533200 | ± 0.000061 |
| inverse semimajor axis [10-6 au-1] | -721.74 | ± 8.58 |
| Epoch (TT) | 16481028 | |
| time of perihelion passage (TT) | 19480215.276061 | ± 0.000370 |
| perihelion distance | 1.49138818 | ± 0.00000319 |
| eccentricity | 0.99995691 | ± 0.00001267 |
| argument of perihelion [deg] | 62.089047 | ± 0.000218 |
| longitude of the ascending node [deg] | 199.256479 | ± 0.000073 |
| inclination [deg] | 77.586851 | ± 0.000061 |
| inverse semimajor axis [10-6 au-1] | 28.89 | ± 8.49 |

| Epoch (TT) | 22471009 | |
| time of perihelion passage (TT) | 19480216.304140 | ± 0.000210 |
| perihelion distance | 1.49784258 | ± 0.00000338 |
| eccentricity | 0.99991866 | ± 0.00001273 |
| argument of perihelion [deg] | 61.829573 | ± 0.000217 |
| longitude of the ascending node [deg] | 199.327504 | ± 0.000072 |
| inclination [deg] | 77.567907 | ± 0.000061 |
| inverse semimajor axis [10-6 au-1] | 54.31 | ± 8.50 |