| Solar System Dynamics & Planetology Group |
|
C/1946 P1 Jones | |
| Solar System Dynamics & Planetology Group |
|
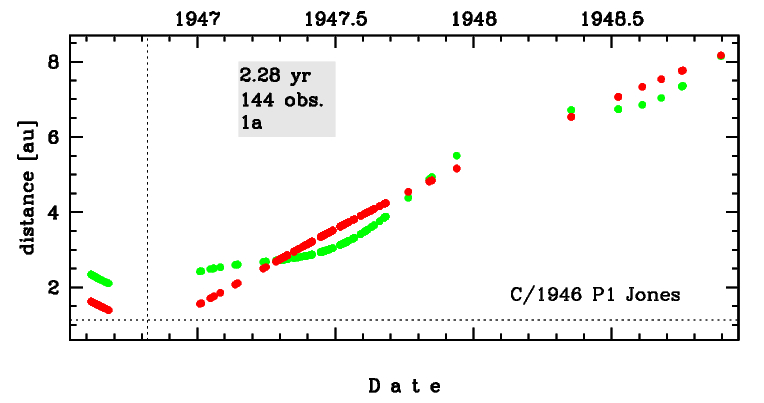
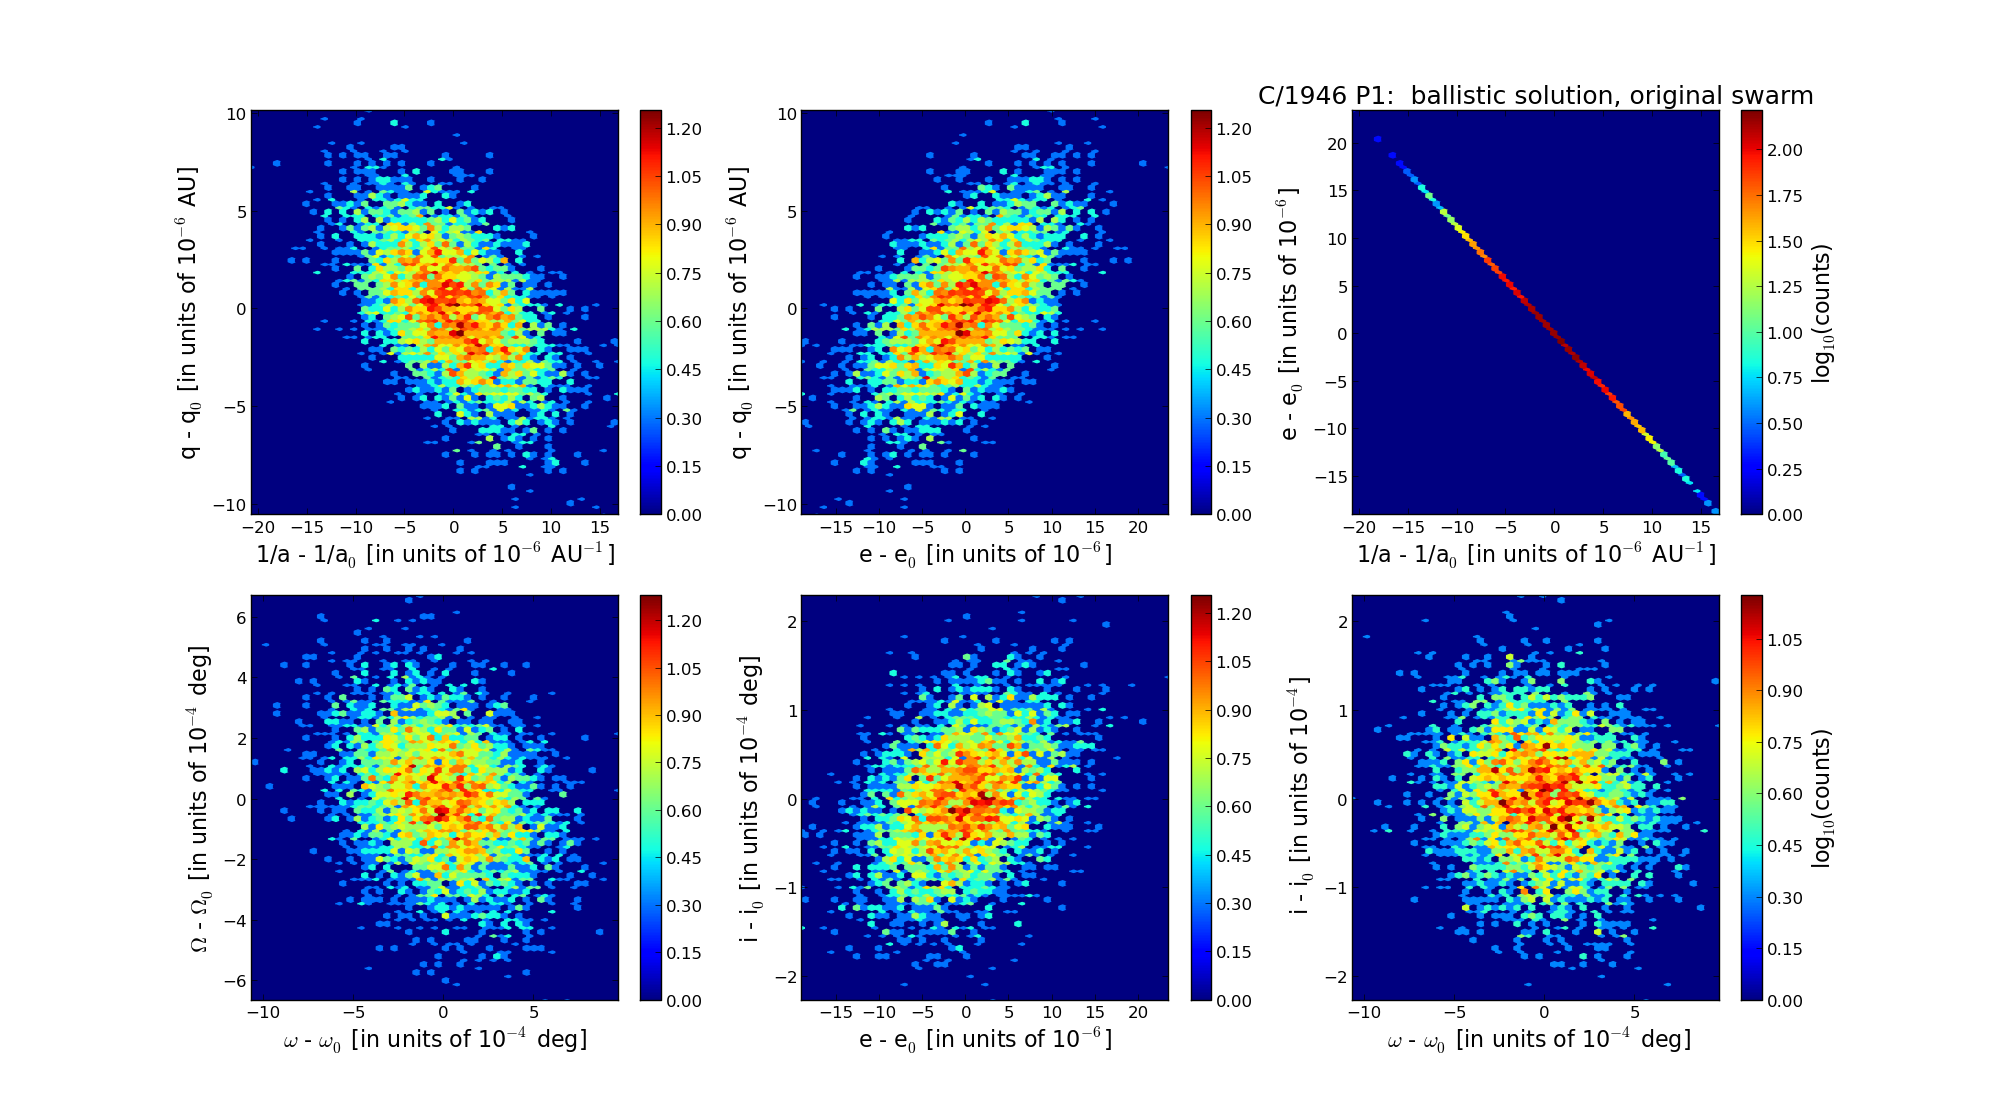
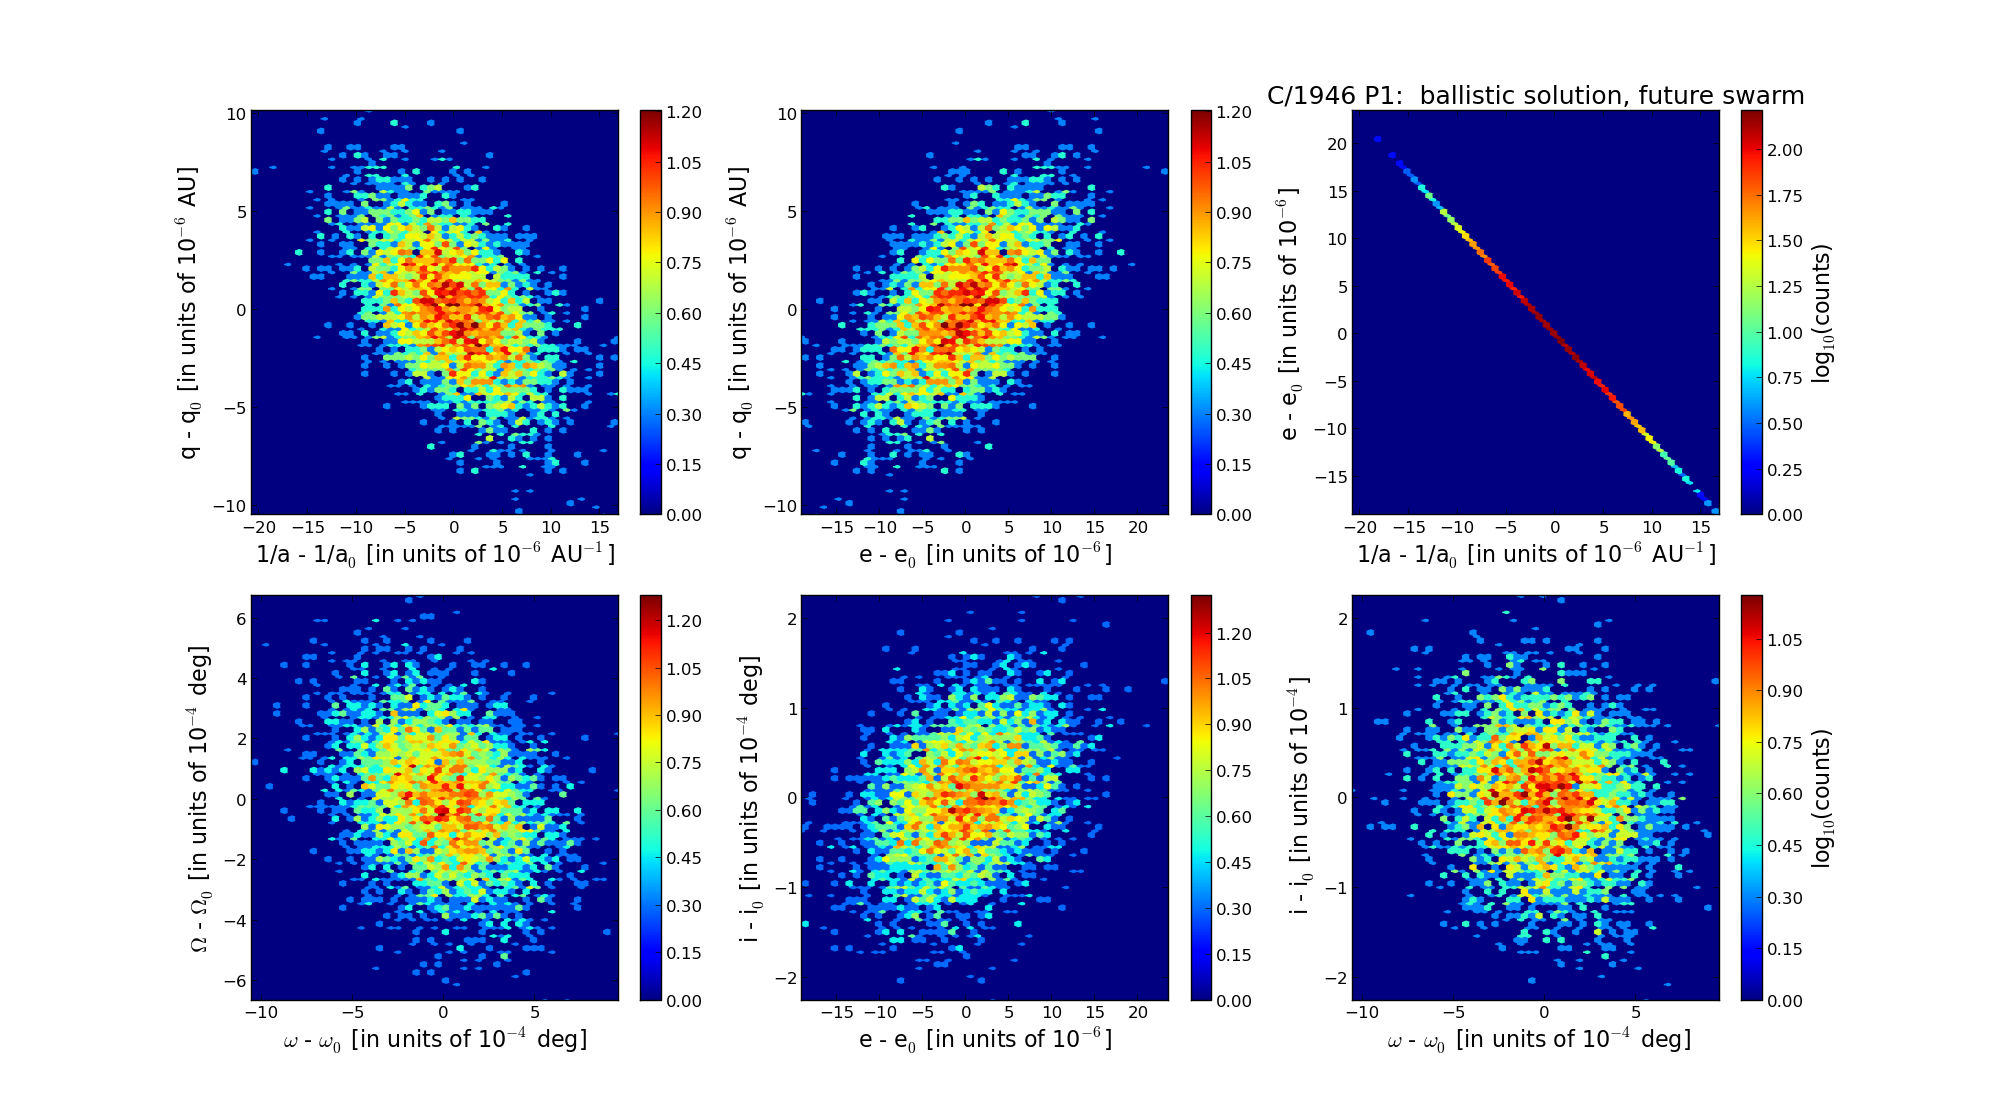
C/1946 P1 Jones | |
| number of observations | 144 |
| number of residuals | 257 |
| data interval | 1946 Aug. 13 — 1948 Nov. 23 |
| rms [arcsec] | 0.99 |
| orbit quality class | 1a |
| Epoch (TT) | 19461027.0 | = JD 2432120.5 |
| time of perihelion passage (TT) | 19461026.778759 | ± 0.000498 |
| perihelion distance | 1.13610604 | ± 0.00000296 |
| eccentricity | 1.00076873 | ± 0.00000562 |
| argument of perihelion [deg] | 320.412716 | ± 0.000277 |
| longitude of the ascending node [deg] | 238.335364 | ± 0.000188 |
| inclination [deg] | 56.964608 | ± 0.000062 |
| inverse semimajor axis [10-6 au-1] | -676.64 | ± 4.94 |
| Epoch (TT) | 16471103 | |
| time of perihelion passage (TT) | 19461026.493829 | ± 0.000520 |
| perihelion distance | 1.12948754 | ± 0.00000300 |
| eccentricity | 0.99994255 | ± 0.00000573 |
| argument of perihelion [deg] | 320.574302 | ± 0.000286 |
| longitude of the ascending node [deg] | 238.295327 | ± 0.000193 |
| inclination [deg] | 57.042068 | ± 0.000064 |
| inverse semimajor axis [10-6 au-1] | 50.86 | ± 5.08 |
| Epoch (TT) | 22450621 | |
| time of perihelion passage (TT) | 19461026.922779 | ± 0.000510 |
| perihelion distance | 1.13244087 | ± 0.00000300 |
| eccentricity | 0.99997447 | ± 0.00000575 |
| argument of perihelion [deg] | 320.262683 | ± 0.000284 |
| longitude of the ascending node [deg] | 238.420478 | ± 0.000193 |
| inclination [deg] | 56.958209 | ± 0.000063 |
| inverse semimajor axis [10-6 au-1] | 22.55 | ± 5.08 |