| Solar System Dynamics & Planetology Group |
|
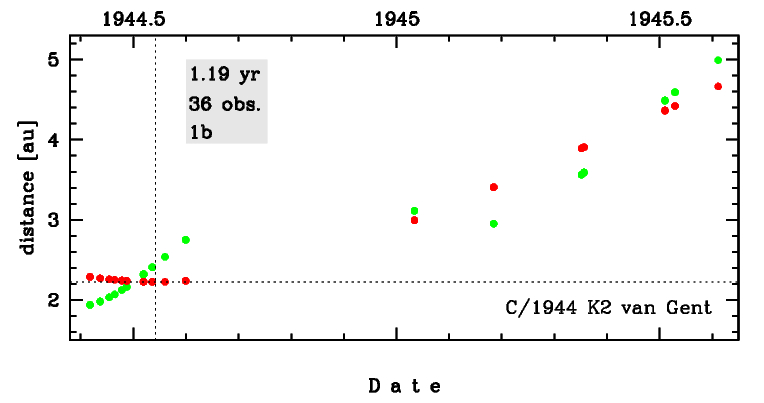
C/1944 K2 van Gent | |
| Solar System Dynamics & Planetology Group |
|
C/1944 K2 van Gent | |
| number of observations | 36 |
| number of residuals | 56 |
| data interval | 1944 June 1 — 1945 Aug. 11 |
| rms [arcsec] | 1.58 |
| orbit quality class | 1b |
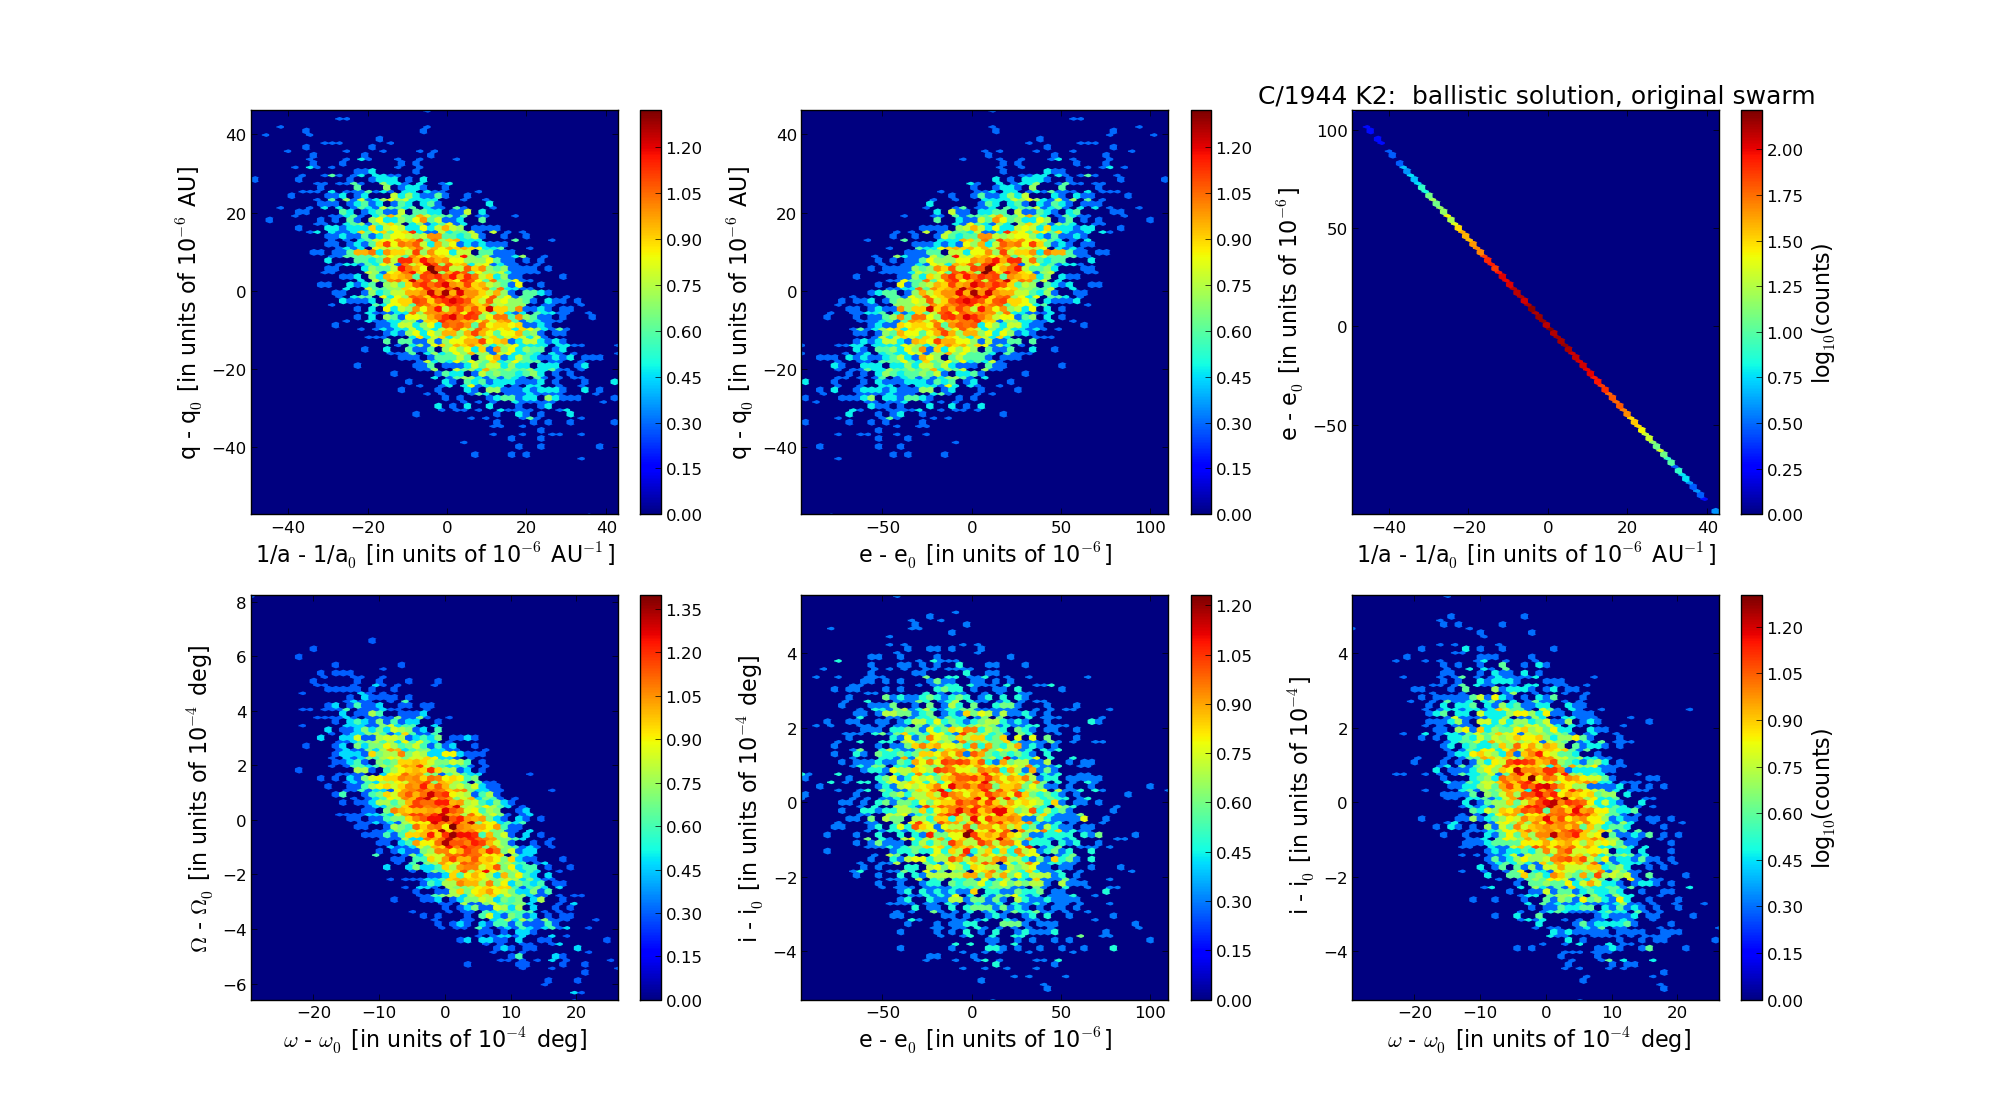
| Epoch (TT) | 19440601.0 | = JD 2431242.5 |
| time of perihelion passage (TT) | 19440717.611796 | ± 0.001868 |
| perihelion distance | 2.22594125 | ± 0.00001342 |
| eccentricity | 1.00205322 | ± 0.00002843 |
| argument of perihelion [deg] | 336.973475 | ± 0.000686 |
| longitude of the ascending node [deg] | 203.500207 | ± 0.000194 |
| inclination [deg] | 95.004881 | ± 0.000159 |
| inverse semimajor axis [10-6 au-1] | -922.41 | ± 12.77 |
| Epoch (TT) | 16440105 | |
| time of perihelion passage (TT) | 19440718.501473 | ± 0.001683 |
| perihelion distance | 2.22564815 | ± 0.00001298 |
| eccentricity | 0.99995373 | ± 0.00002854 |
| argument of perihelion [deg] | 337.096904 | ± 0.000687 |
| longitude of the ascending node [deg] | 203.525912 | ± 0.000191 |
| inclination [deg] | 95.124917 | ± 0.000157 |
| inverse semimajor axis [10-6 au-1] | 20.79 | ± 12.82 |
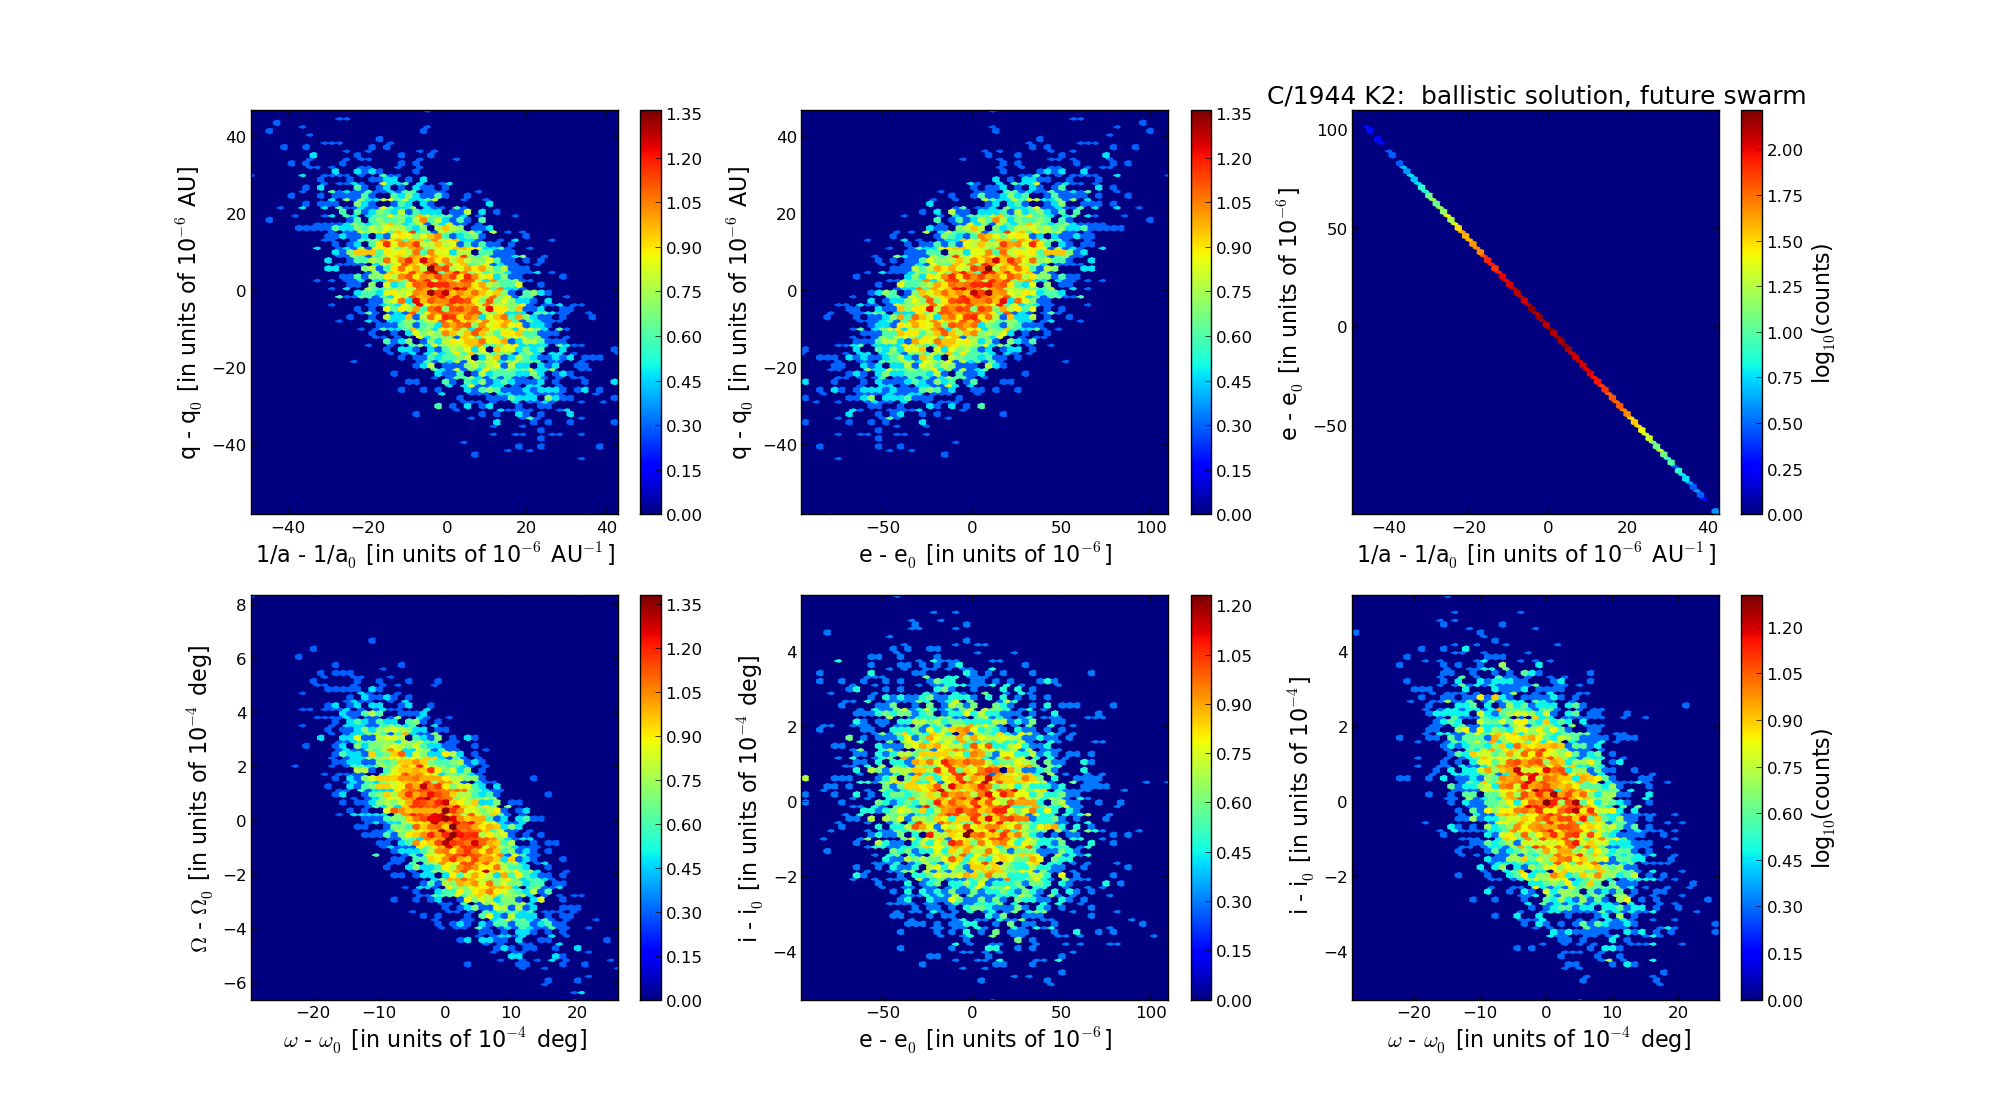
| Epoch (TT) | 22390215 | |
| time of perihelion passage (TT) | 19440718.115518 | ± 0.001858 |
| perihelion distance | 2.22184587 | ± 0.00001318 |
| eccentricity | 1.00115253 | ± 0.00002848 |
| argument of perihelion [deg] | 336.928234 | ± 0.000683 |
| longitude of the ascending node [deg] | 203.612746 | ± 0.000193 |
| inclination [deg] | 94.989126 | ± 0.000156 |
| inverse semimajor axis [10-6 au-1] | -518.73 | ± 12.81 |