| Solar System Dynamics & Planetology Group |
|
C/1941 K1 van Gent | |
| Solar System Dynamics & Planetology Group |
|
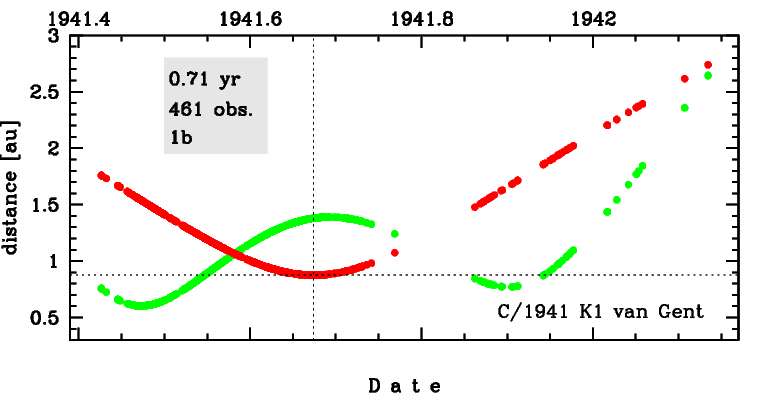
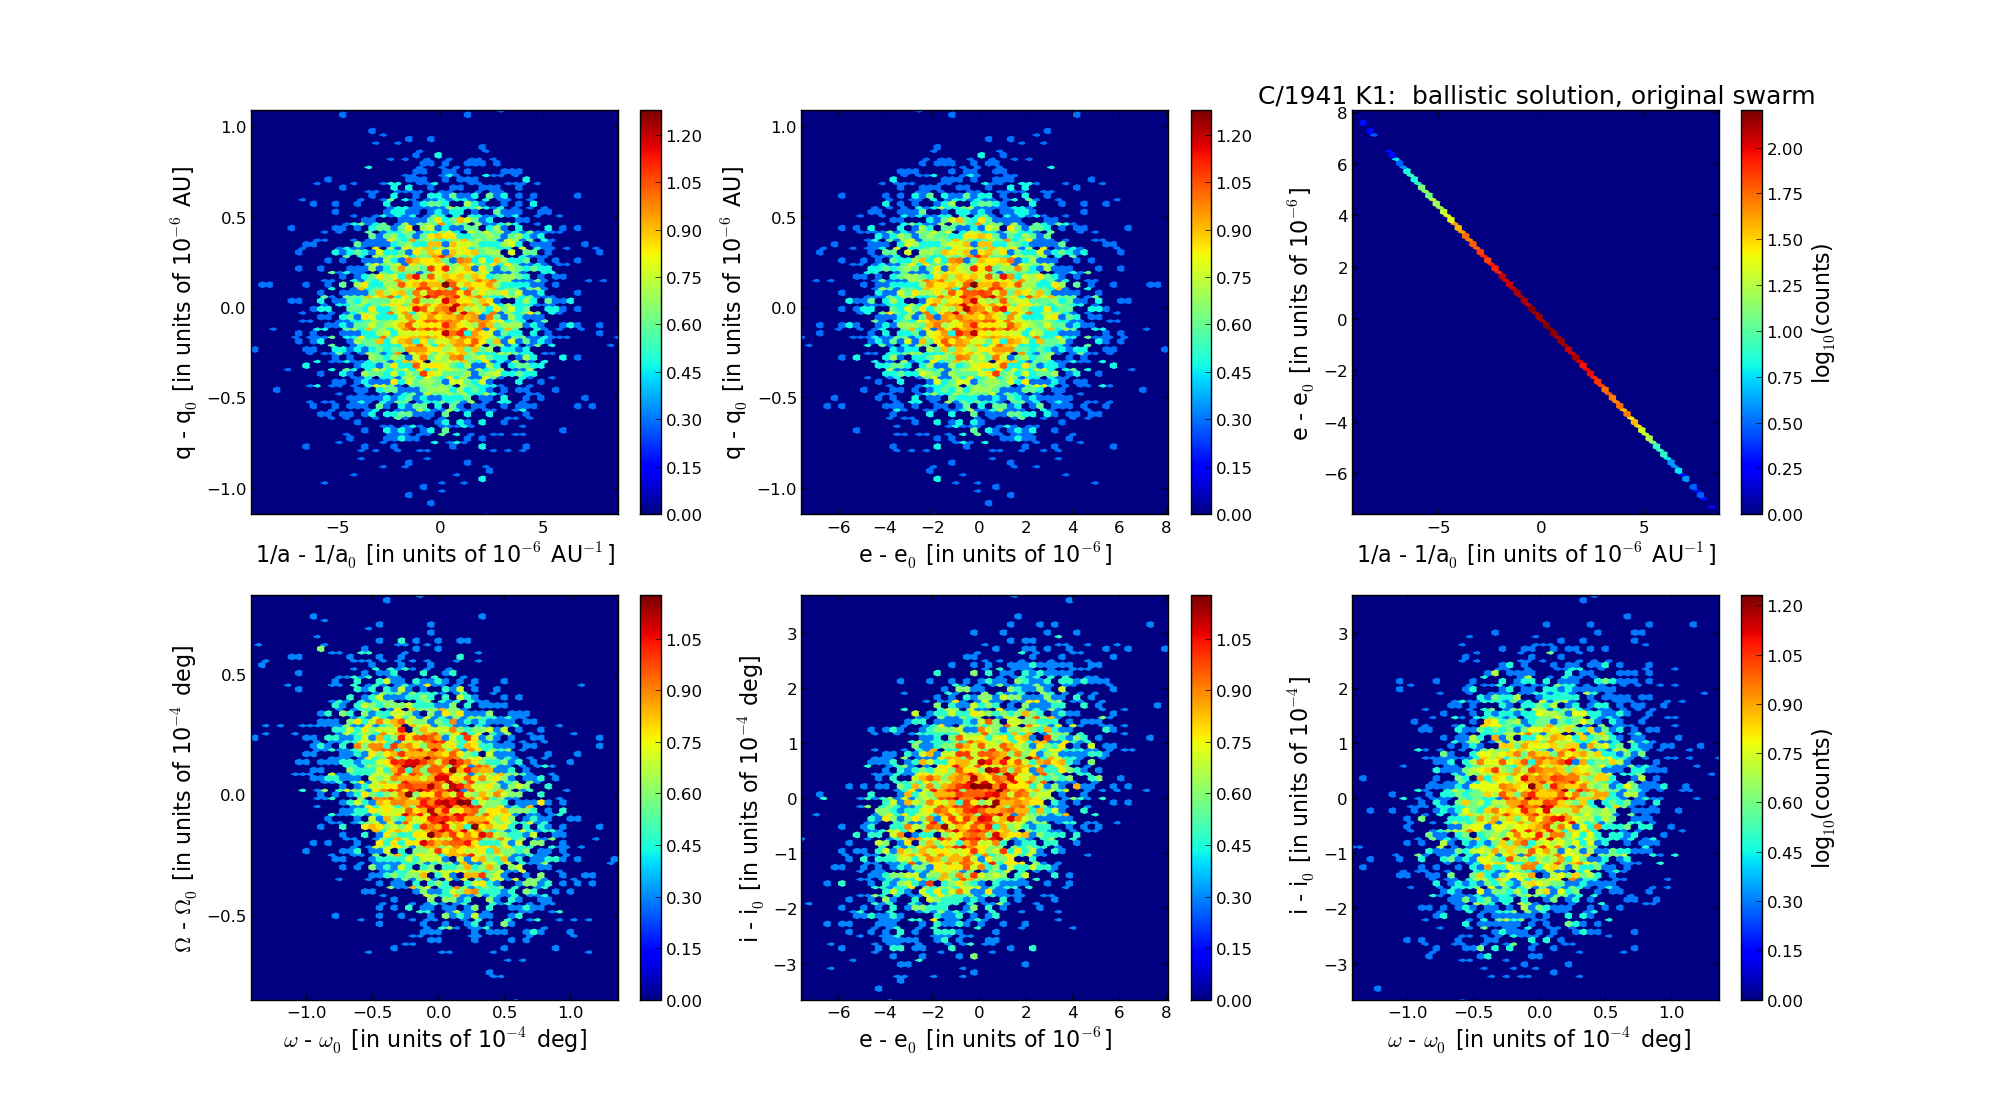
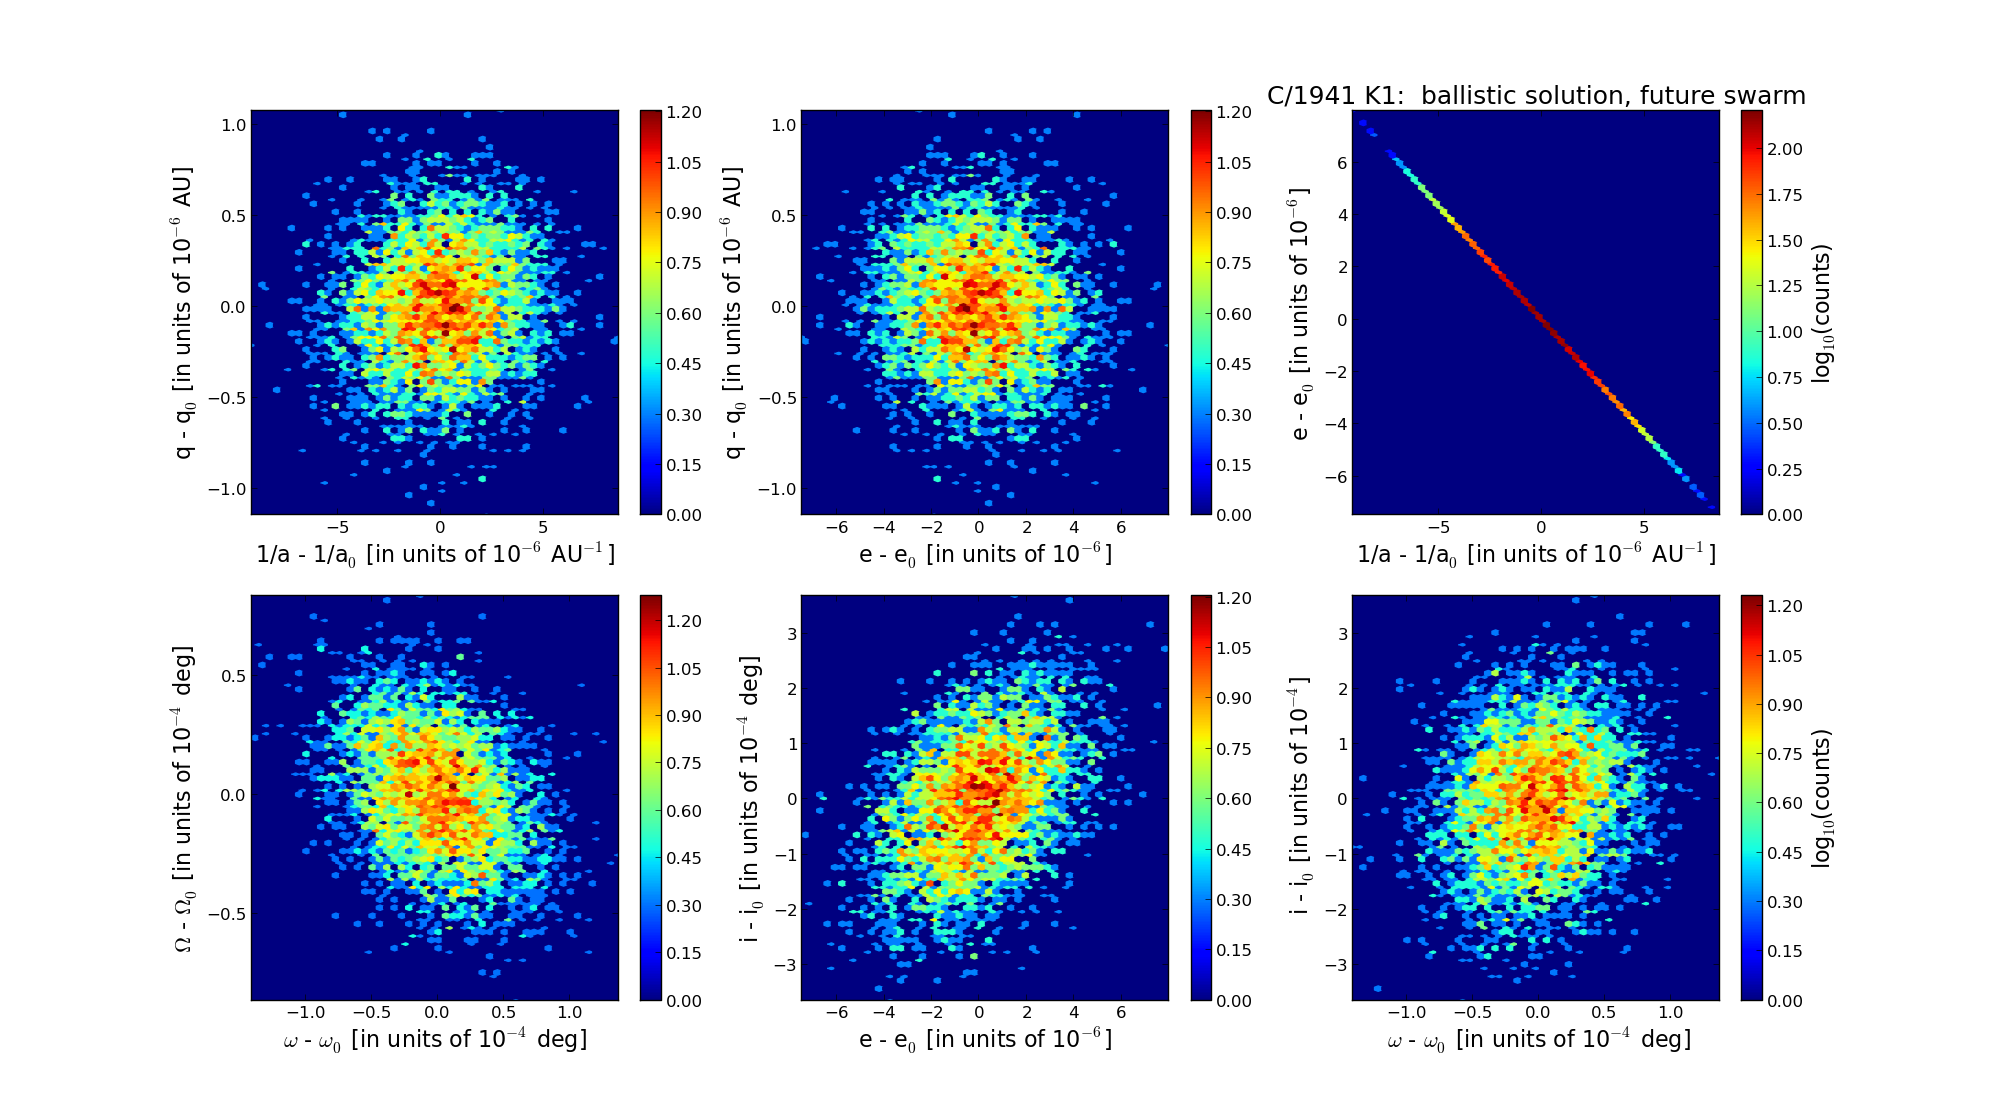
C/1941 K1 van Gent | |
| number of observations | 461 |
| number of residuals | 801 |
| data interval | 1941 June 4 — 1942 Feb. 18 |
| rms [arcsec] | 2.22 |
| orbit quality class | 1b |
| Epoch (TT) | 19410903.0 | = JD 2430240.5 |
| time of perihelion passage (TT) | 19410903.184122 | ± 0.000051 |
| perihelion distance | 0.87479022 | ± 0.00000031 |
| eccentricity | 1.00026410 | ± 0.00000216 |
| argument of perihelion [deg] | 85.321879 | ± 0.000038 |
| longitude of the ascending node [deg] | 257.559607 | ± 0.000024 |
| inclination [deg] | 94.517037 | ± 0.000106 |
| inverse semimajor axis [10-6 au-1] | -301.90 | ± 2.47 |
| Epoch (TT) | 16430217 | |
| time of perihelion passage (TT) | 19410903.211543 | ± 0.000061 |
| perihelion distance | 0.87864337 | ± 0.00000031 |
| eccentricity | 0.99995265 | ± 0.00000217 |
| argument of perihelion [deg] | 85.289643 | ± 0.000038 |
| longitude of the ascending node [deg] | 257.546307 | ± 0.000024 |
| inclination [deg] | 94.468456 | ± 0.000108 |
| inverse semimajor axis [10-6 au-1] | 53.89 | ± 2.47 |
| Epoch (TT) | 22410712 | |
| time of perihelion passage (TT) | 19410904.986298 | ± 0.000077 |
| perihelion distance | 0.86551738 | ± 0.00000031 |
| eccentricity | 0.99985613 | ± 0.00000213 |
| argument of perihelion [deg] | 85.103947 | ± 0.000038 |
| longitude of the ascending node [deg] | 257.564985 | ± 0.000024 |
| inclination [deg] | 94.558245 | ± 0.000108 |
| inverse semimajor axis [10-6 au-1] | 166.22 | ± 2.47 |