| Solar System Dynamics & Planetology Group |
|
C/1940 S1 Okabyashi-Honda | |
| Solar System Dynamics & Planetology Group |
|
C/1940 S1 Okabyashi-Honda | |
| number of observations | 38 |
| number of residuals | 61 |
| data interval | 1940 Oct. 4 — 1941 Jan. 3 |
| rms [arcsec] | 3.67 |
| orbit quality class | 2b |
| Epoch (TT) | 19400730.0 | = JD 2429840.5 |
| time of perihelion passage (TT) | 19400815.741520 | ± 0.018720 |
| perihelion distance | 1.06134353 | ± 0.00042312 |
| eccentricity | 1.00101170 | ± 0.00044419 |
| argument of perihelion [deg] | 329.641162 | ± 0.036347 |
| longitude of the ascending node [deg] | 128.060306 | ± 0.006071 |
| inclination [deg] | 133.112612 | ± 0.001116 |
| inverse semimajor axis [10-6 au-1] | -953.22 | ± 418.31 |
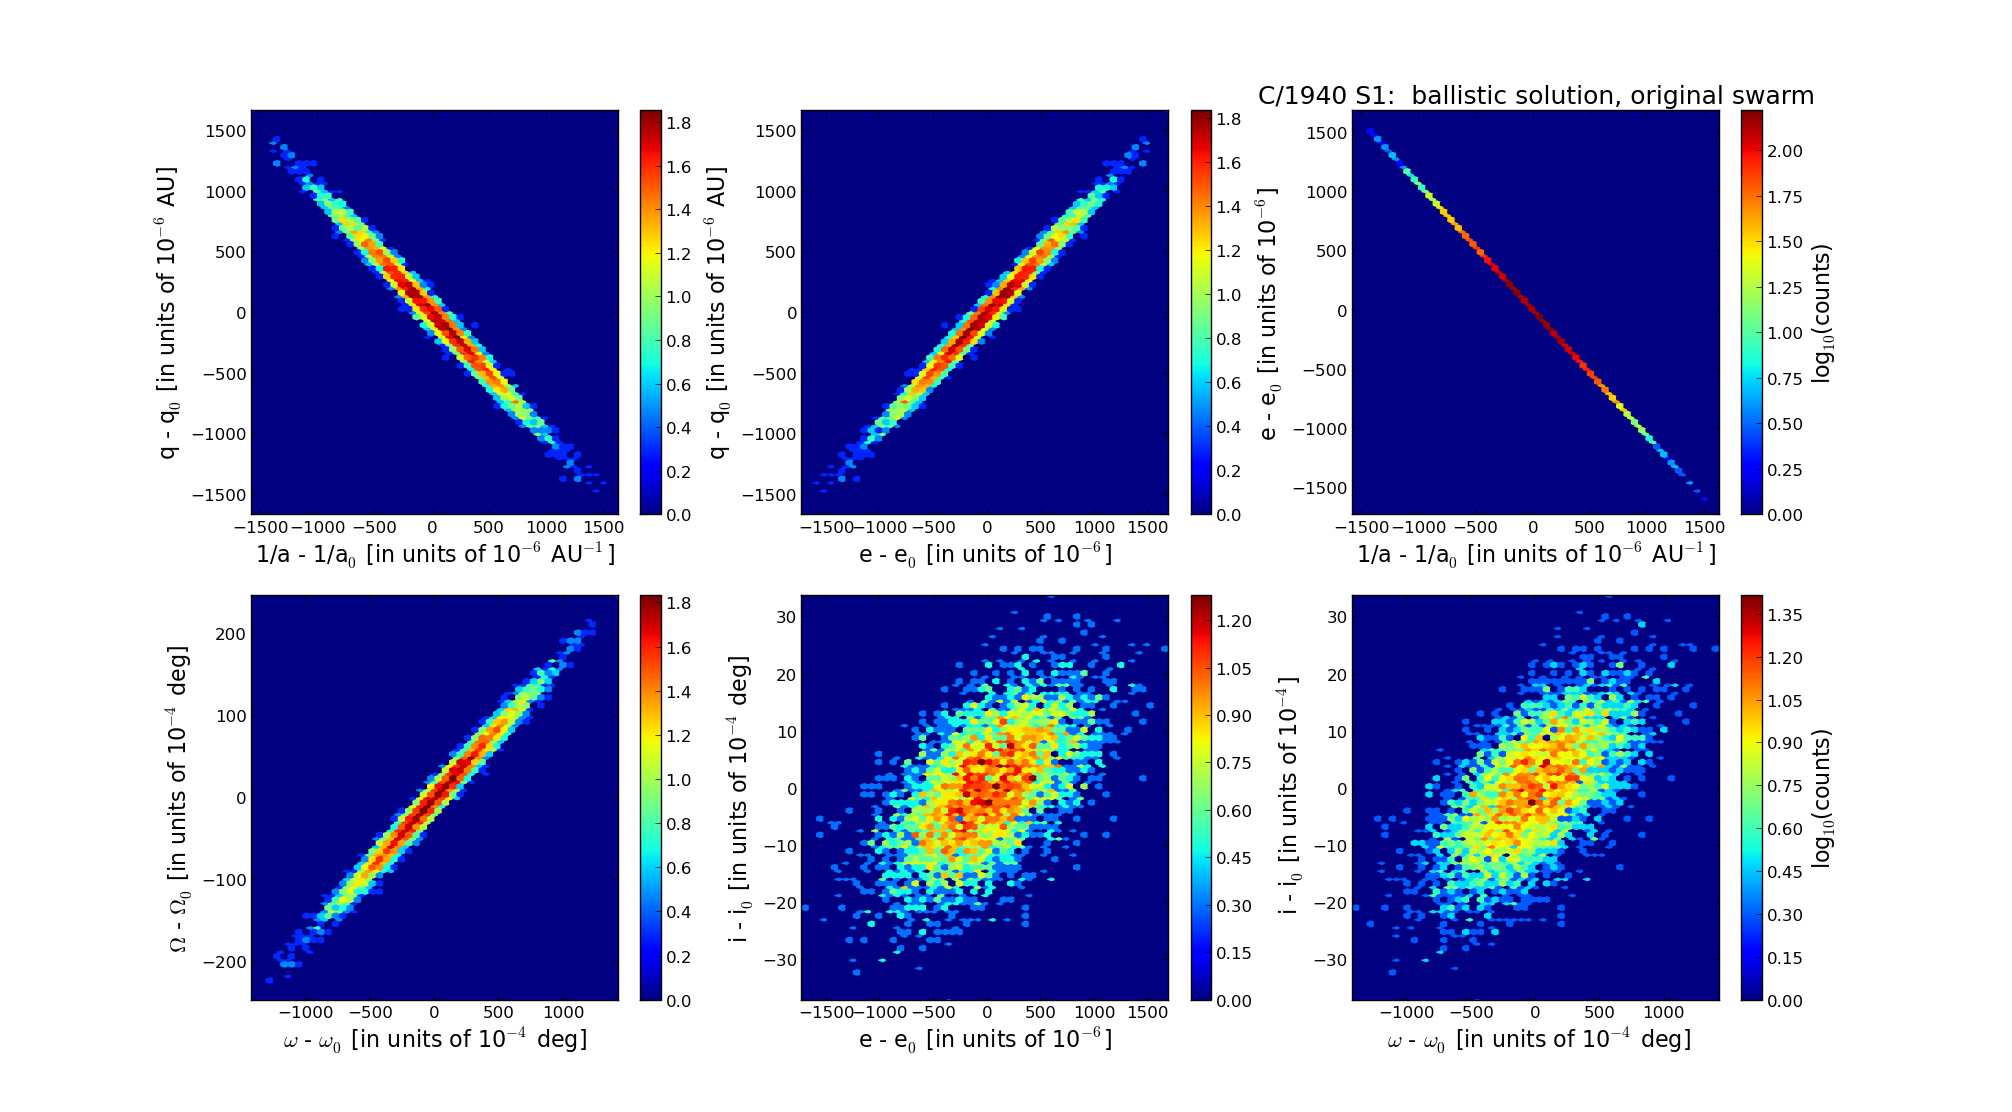
| Epoch (TT) | 16381220 | |
| time of perihelion passage (TT) | 19400816.604848 | ± 0.016028 |
| perihelion distance | 1.06507308 | ± 0.00043378 |
| eccentricity | 0.99968363 | ± 0.00045462 |
| argument of perihelion [deg] | 329.678357 | ± 0.037246 |
| longitude of the ascending node [deg] | 128.069124 | ± 0.006471 |
| inclination [deg] | 133.275676 | ± 0.000940 |
| inverse semimajor axis [10-6 au-1] | 297.04 | ± 426.96 |
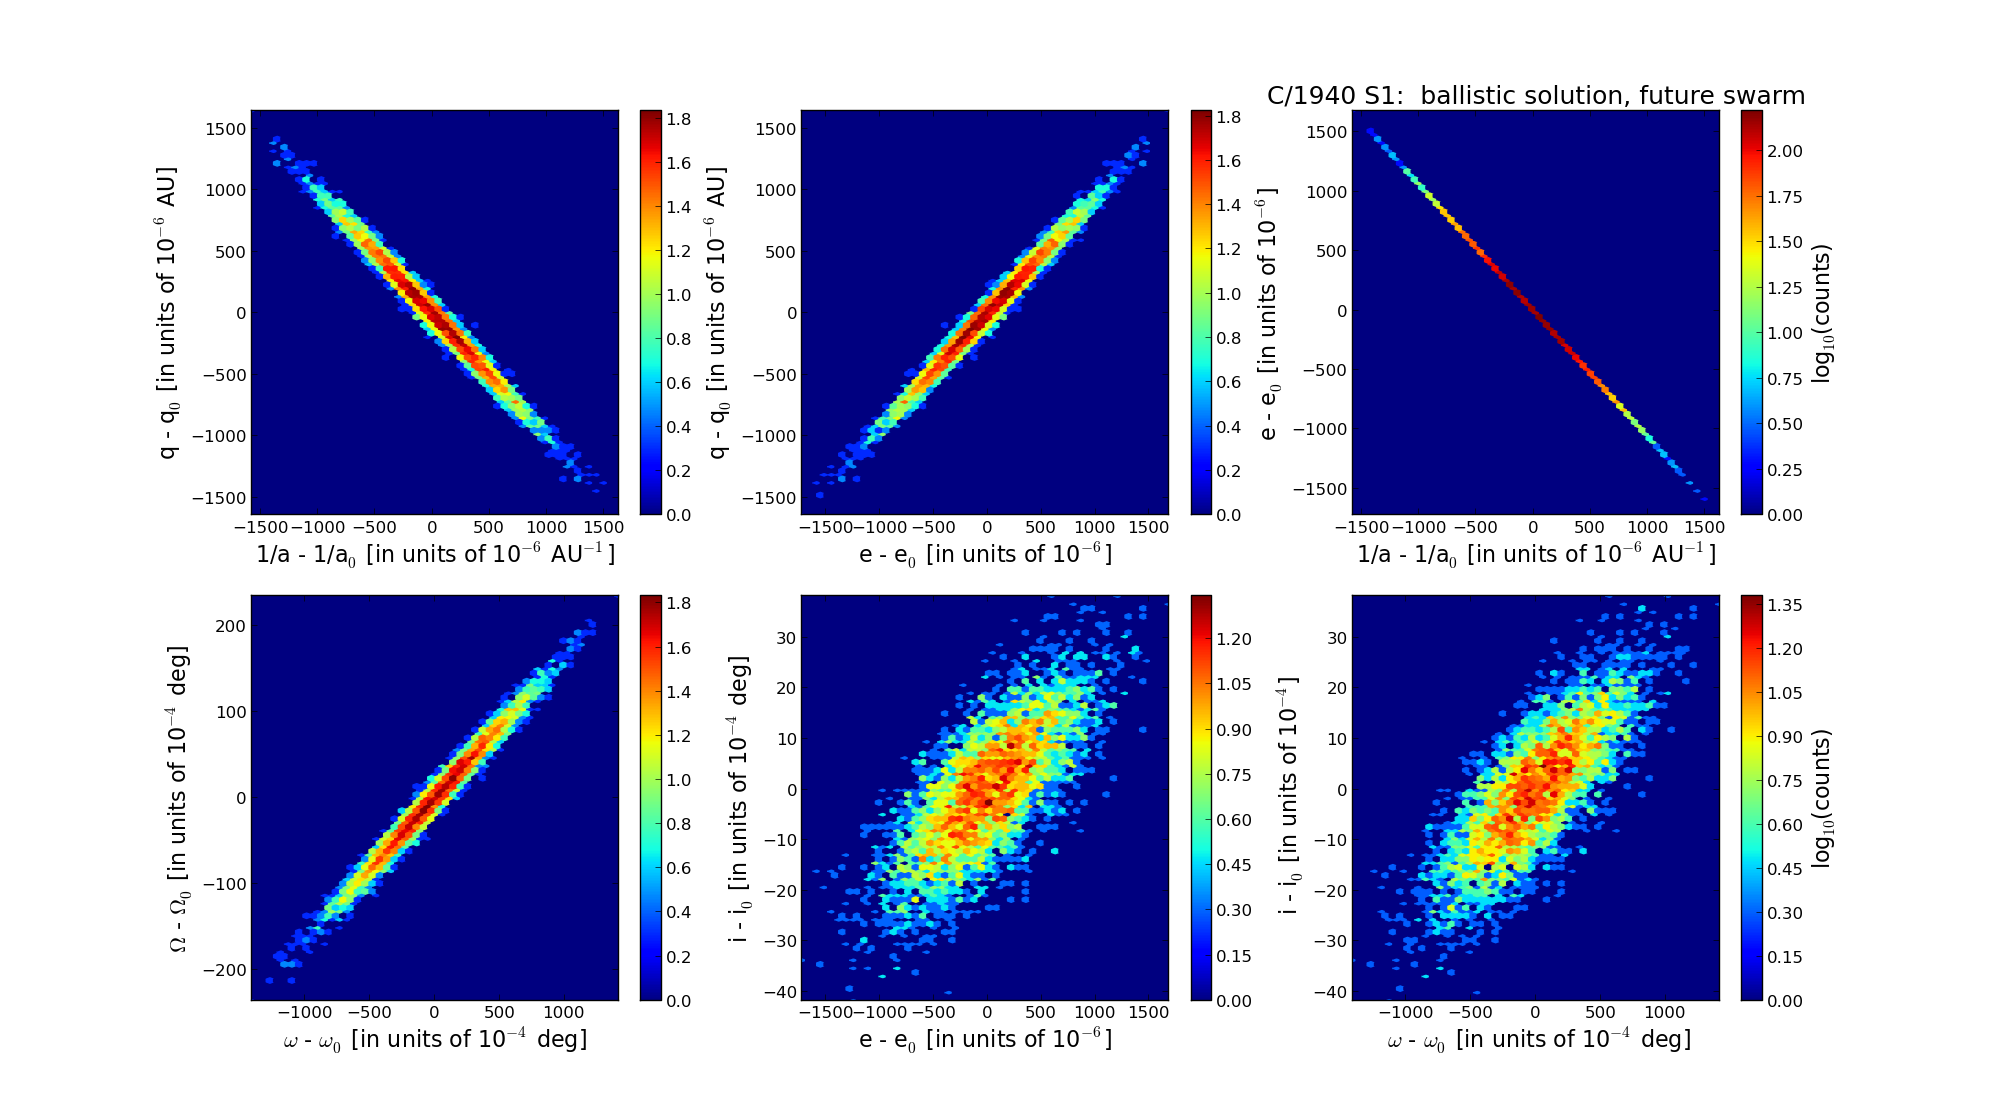
| Epoch (TT) | 22310506 | |
| time of perihelion passage (TT) | 19400816.426110 | ± 0.020136 |
| perihelion distance | 1.05927916 | ± 0.00042722 |
| eccentricity | 1.00074474 | ± 0.00045233 |
| argument of perihelion [deg] | 329.790299 | ± 0.036974 |
| longitude of the ascending node [deg] | 128.282572 | ± 0.006163 |
| inclination [deg] | 133.042273 | ± 0.001158 |
| inverse semimajor axis [10-6 au-1] | -703.06 | ± 426.73 |
