| Solar System Dynamics & Planetology Group |
|
C/1932 M1 Newman | |
| Solar System Dynamics & Planetology Group |
|
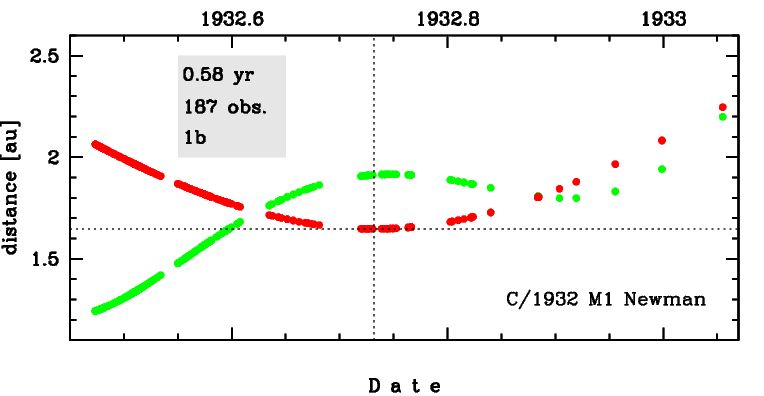
C/1932 M1 Newman | |
| number of observations | 188 |
| number of residuals | 325 |
| data interval | 1932 June 21 — 1933 Jan. 20 |
| rms [arcsec] | 2.60 |
| orbit quality class | 1b |
| Epoch (TT) | 19320910.0 | = JD 2426960.5 |
| time of perihelion passage (TT) | 19320924.551075 | ± 0.000982 |
| perihelion distance | 1.64736493 | ± 0.00001195 |
| eccentricity | 1.00046840 | ± 0.00003229 |
| argument of perihelion [deg] | 69.787385 | ± 0.000647 |
| longitude of the ascending node [deg] | 246.090506 | ± 0.000230 |
| inclination [deg] | 78.388394 | ± 0.000200 |
| inverse semimajor axis [10-6 au-1] | -284.33 | ± 19.60 |
| Epoch (TT) | 16330301 | |
| time of perihelion passage (TT) | 19320923.758305 | ± 0.001011 |
| perihelion distance | 1.64447847 | ± 0.00001183 |
| eccentricity | 0.99996018 | ± 0.00003190 |
| argument of perihelion [deg] | 69.867810 | ± 0.000641 |
| longitude of the ascending node [deg] | 246.157067 | ± 0.000228 |
| inclination [deg] | 78.369050 | ± 0.000199 |
| inverse semimajor axis [10-6 au-1] | 24.21 | ± 19.40 |

| Epoch (TT) | 22290406 | |
| time of perihelion passage (TT) | 19320924.831765 | ± 0.001018 |
| perihelion distance | 1.64649976 | ± 0.00001202 |
| eccentricity | 1.00040467 | ± 0.00003194 |
| argument of perihelion [deg] | 69.763011 | ± 0.000641 |
| longitude of the ascending node [deg] | 246.059025 | ± 0.000225 |
| inclination [deg] | 78.330249 | ± 0.000200 |
| inverse semimajor axis [10-6 au-1] | -245.77 | ± 19.40 |