| Solar System Dynamics & Planetology Group |
|
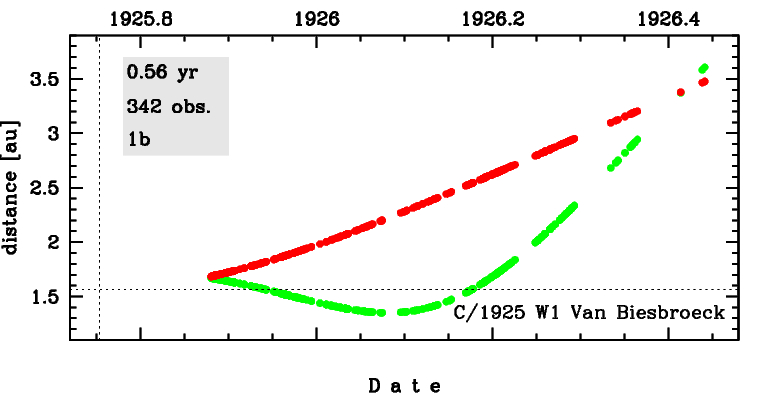
C/1925 W1 van Biesbroeck | |
| Solar System Dynamics & Planetology Group |
|
C/1925 W1 van Biesbroeck | |
| number of observations | 342 |
| number of residuals | 593 |
| data interval | 1925 Nov. 17 — 1926 June 10 |
| rms [arcsec] | 1.94 |
| orbit quality class | 1b |
| Epoch (TT) | 19251017.0 | = JD 2424440.5 |
| time of perihelion passage (TT) | 19251002.973357 | ± 0.000325 |
| perihelion distance | 1.56621518 | ± 0.00001487 |
| eccentricity | 1.00037453 | ± 0.00001486 |
| argument of perihelion [deg] | 106.398480 | ± 0.000589 |
| longitude of the ascending node [deg] | 335.612555 | ± 0.000042 |
| inclination [deg] | 49.329746 | ± 0.000404 |
| inverse semimajor axis [10-6 au-1] | -239.13 | ± 9.49 |

| Epoch (TT) | 16260407 | |
| time of perihelion passage (TT) | 19251002.714744 | ± 0.000382 |
| perihelion distance | 1.56532856 | ± 0.00001534 |
| eccentricity | 0.99995524 | ± 0.00001506 |
| argument of perihelion [deg] | 106.401280 | ± 0.000599 |
| longitude of the ascending node [deg] | 335.706396 | ± 0.000041 |
| inclination [deg] | 49.270625 | ± 0.000414 |
| inverse semimajor axis [10-6 au-1] | 28.59 | ± 9.62 |

| Epoch (TT) | 22210518 | |
| time of perihelion passage (TT) | 19251003.313123 | ± 0.000286 |
| perihelion distance | 1.56877876 | ± 0.00001517 |
| eccentricity | 1.00049850 | ± 0.00001508 |
| argument of perihelion [deg] | 106.484194 | ± 0.000597 |
| longitude of the ascending node [deg] | 335.500024 | ± 0.000042 |
| inclination [deg] | 49.276562 | ± 0.000414 |
| inverse semimajor axis [10-6 au-1] | -317.76 | ± 9.61 |