| Solar System Dynamics & Planetology Group |
|
C/1925 G1 Orkisz | |
| Solar System Dynamics & Planetology Group |
|
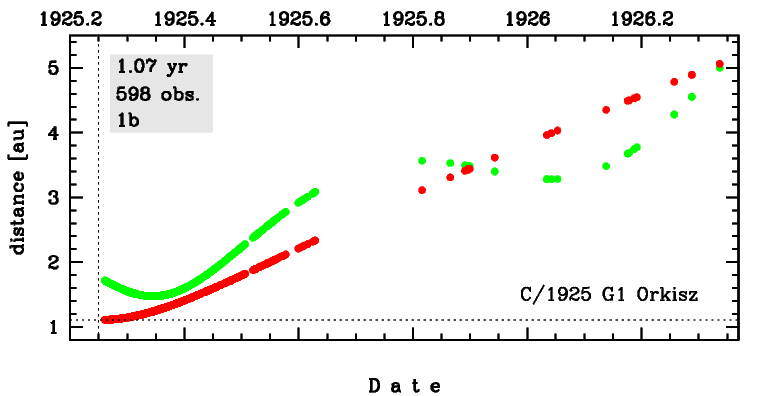
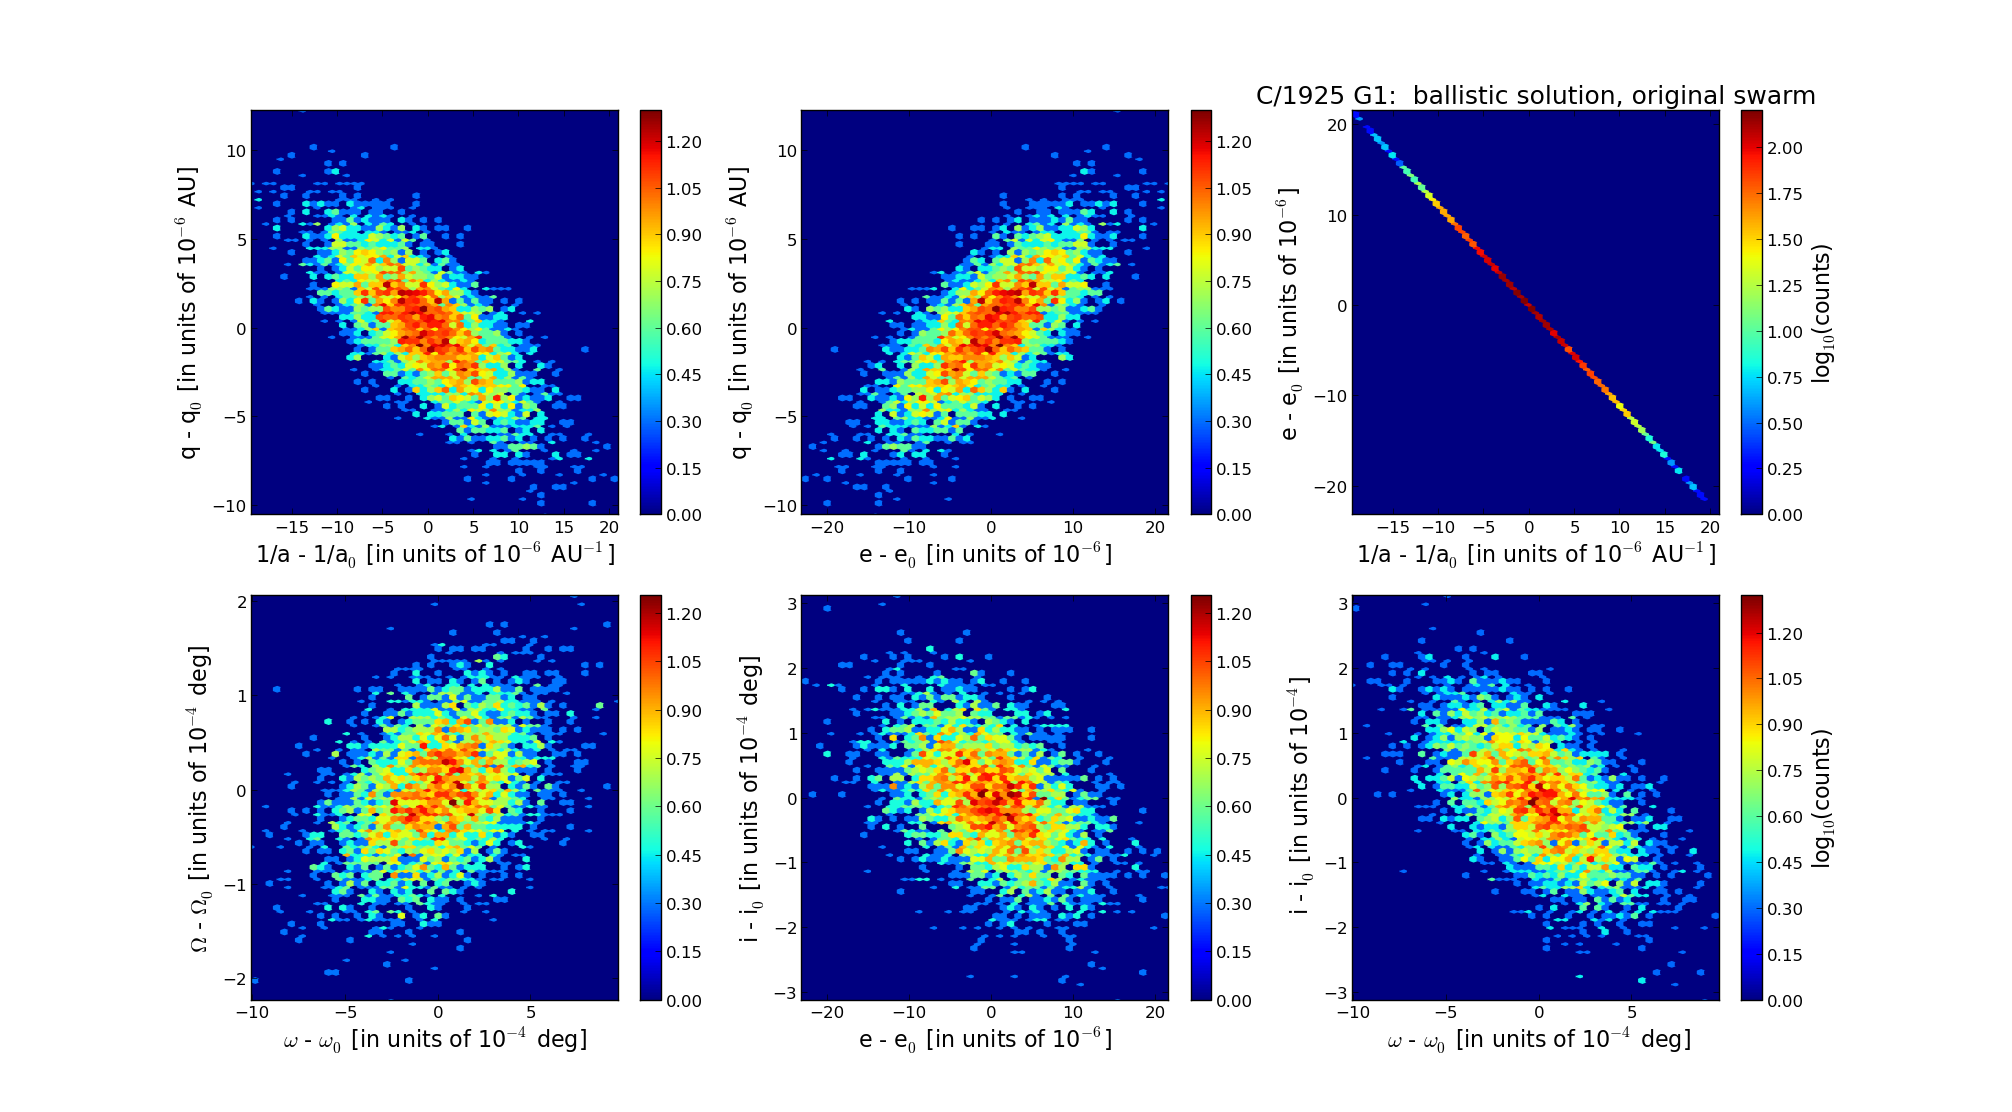
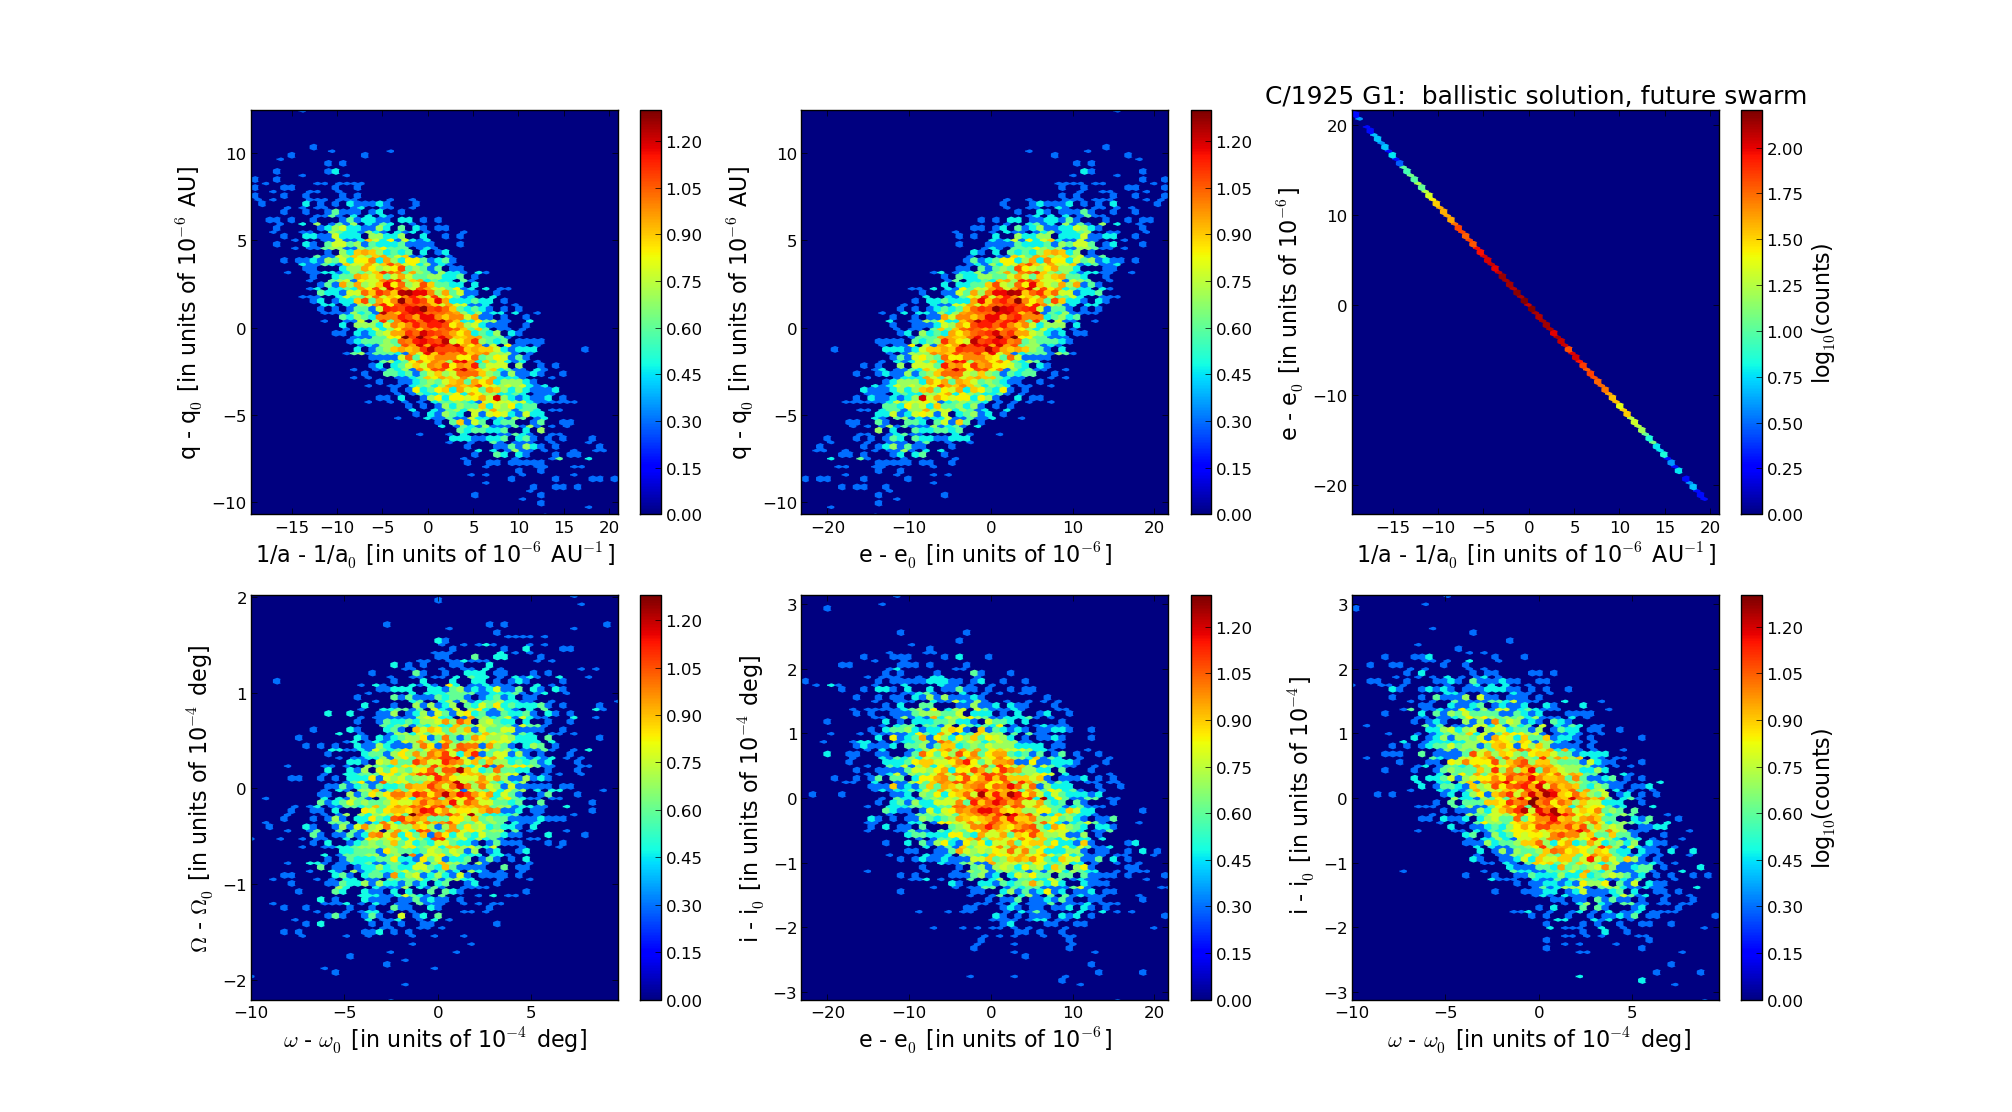
C/1925 G1 Orkisz | |
| number of observations | 598 |
| number of residuals | 964 |
| data interval | 1925 Apr. 5 — 1926 May 2 |
| rms [arcsec] | 2.79 |
| orbit quality class | 1b |
| Epoch (TT) | 19250331.0 | = JD 2424240.5 |
| time of perihelion passage (TT) | 19250401.506580 | ± 0.000240 |
| perihelion distance | 1.10948315 | ± 0.00000309 |
| eccentricity | 1.00060414 | ± 0.00000642 |
| argument of perihelion [deg] | 36.181542 | ± 0.000283 |
| longitude of the ascending node [deg] | 319.109303 | ± 0.000059 |
| inclination [deg] | 100.022632 | ± 0.000080 |
| inverse semimajor axis [10-6 au-1] | -544.52 | ± 5.78 |
| Epoch (TT) | 16260626 | |
| time of perihelion passage (TT) | 19250331.956264 | ± 0.000268 |
| perihelion distance | 1.10542489 | ± 0.00000304 |
| eccentricity | 0.99995575 | ± 0.00000635 |
| argument of perihelion [deg] | 36.344786 | ± 0.000283 |
| longitude of the ascending node [deg] | 319.188844 | ± 0.000060 |
| inclination [deg] | 100.089542 | ± 0.000081 |
| inverse semimajor axis [10-6 au-1] | 40.03 | ± 5.74 |
| Epoch (TT) | 22171006 | |
| time of perihelion passage (TT) | 19250401.599089 | ± 0.000224 |
| perihelion distance | 1.10790258 | ± 0.00000311 |
| eccentricity | 1.00058995 | ± 0.00000637 |
| argument of perihelion [deg] | 36.149443 | ± 0.000282 |
| longitude of the ascending node [deg] | 319.121445 | ± 0.000059 |
| inclination [deg] | 99.886189 | ± 0.000081 |
| inverse semimajor axis [10-6 au-1] | -532.49 | ± 5.74 |