| Solar System Dynamics & Planetology Group |
|
C/1925 F1 Shajn–Comas Sola | |
| Solar System Dynamics & Planetology Group |
|
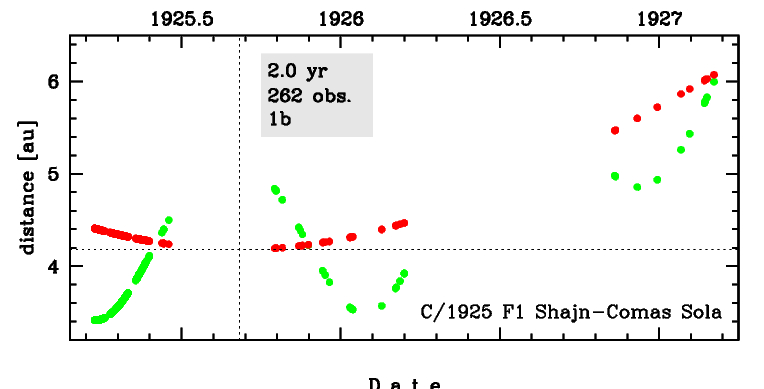
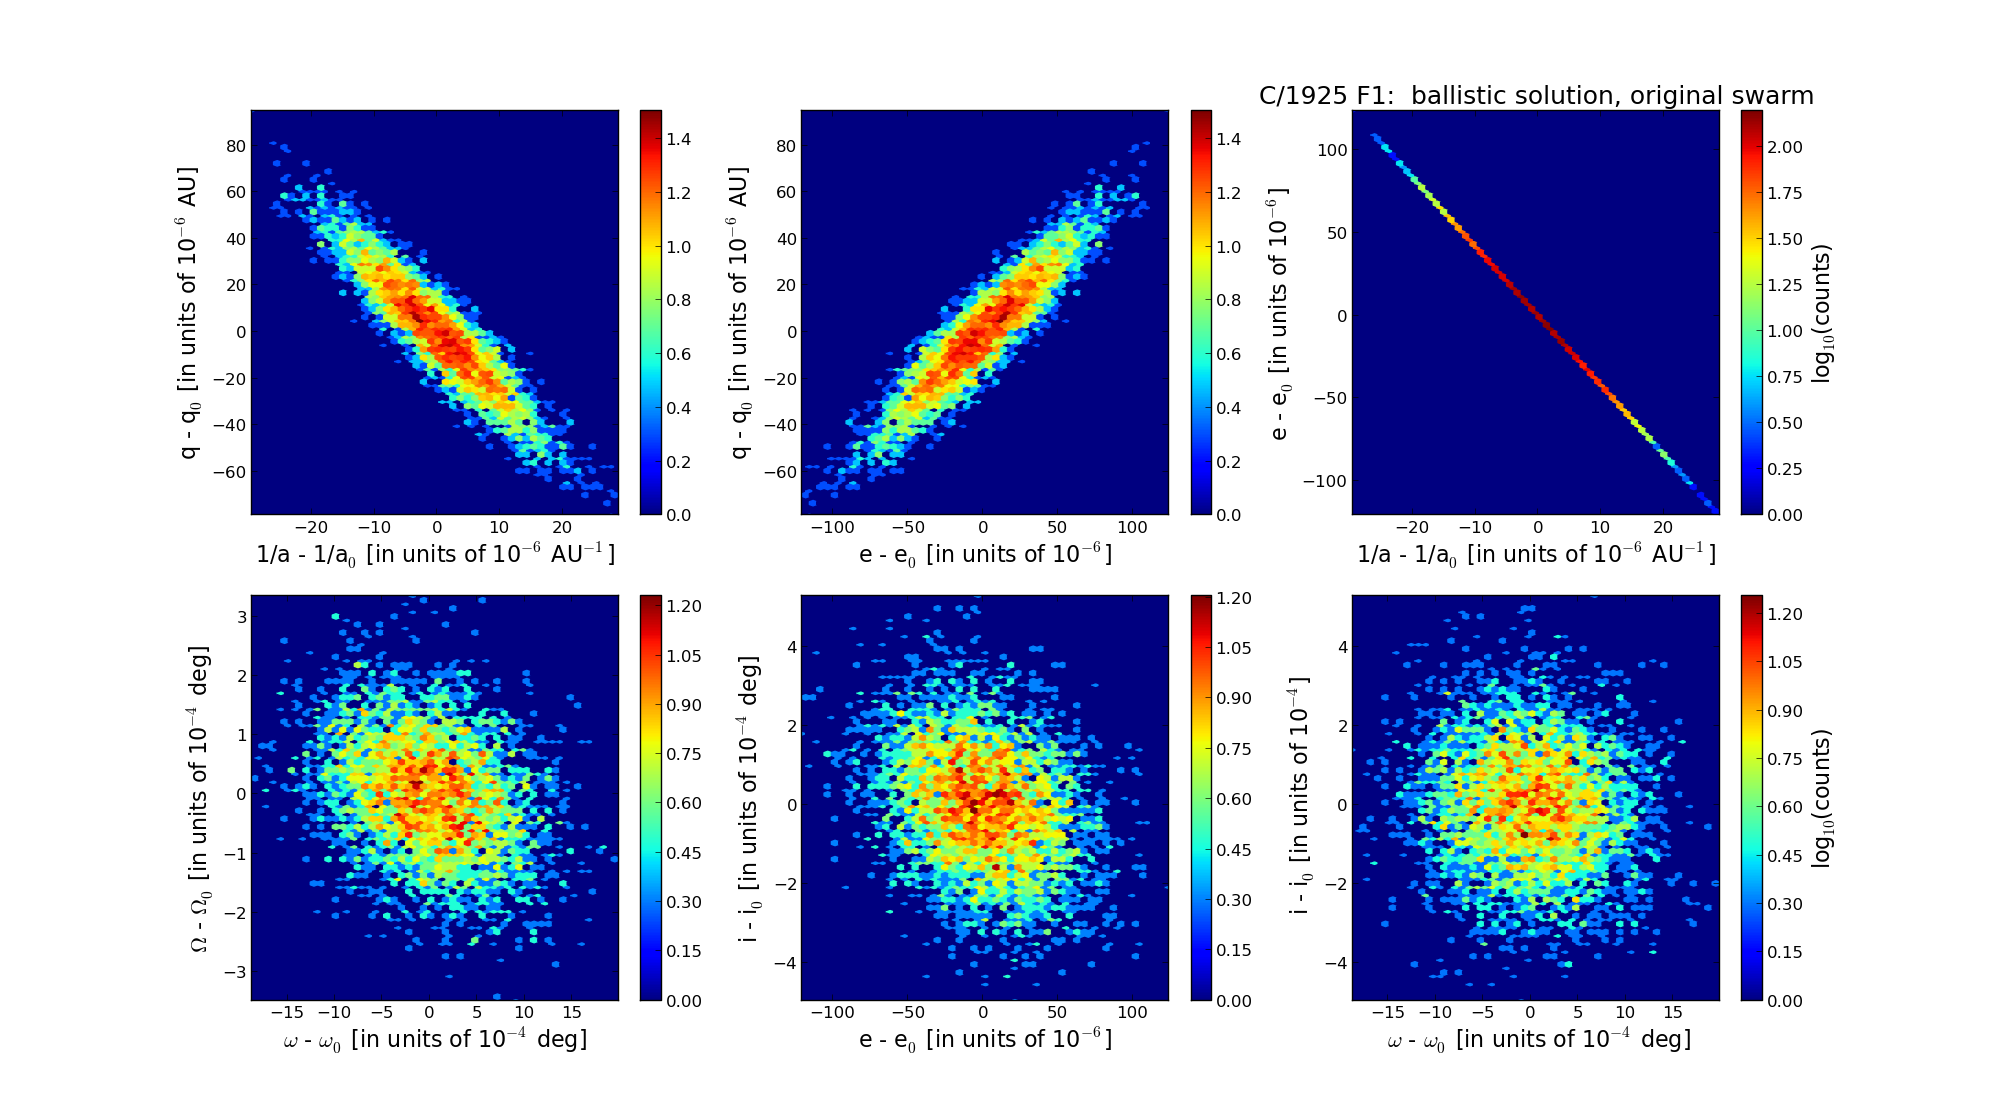
C/1925 F1 Shajn–Comas Sola | |
| number of observations | 265 |
| number of residuals | 463 |
| data interval | 1925 Mar. 22 — 1927 Mar. 4 |
| rms [arcsec] | 2.75 |
| orbit quality class | 1b |
| Epoch (TT) | 19250907.0 | = JD 2424400.5 |
| time of perihelion passage (TT) | 19250906.941564 | ± 0.003963 |
| perihelion distance | 4.18078079 | ± 0.00002336 |
| eccentricity | 1.00243417 | ± 0.00003527 |
| argument of perihelion [deg] | 205.759883 | ± 0.000570 |
| longitude of the ascending node [deg] | 358.539358 | ± 0.000095 |
| inclination [deg] | 146.713185 | ± 0.000143 |
| inverse semimajor axis [10-6 au-1] | -582.23 | ± 8.43 |
| Epoch (TT) | 16210722 | |
| time of perihelion passage (TT) | 19250906.261864 | ± 0.003958 |
| perihelion distance | 4.17819249 | ± 0.00002340 |
| eccentricity | 0.99985439 | ± 0.00003482 |
| argument of perihelion [deg] | 205.622401 | ± 0.000574 |
| longitude of the ascending node [deg] | 358.368841 | ± 0.000093 |
| inclination [deg] | 146.741752 | ± 0.000145 |
| inverse semimajor axis [10-6 au-1] | 34.85 | ± 8.33 |

| Epoch (TT) | 22301127 | |
| time of perihelion passage (TT) | 19250905.761751 | ± 0.004023 |
| perihelion distance | 4.18479767 | ± 0.00002337 |
| eccentricity | 0.99946443 | ± 0.00003487 |
| argument of perihelion [deg] | 205.679732 | ± 0.000573 |
| longitude of the ascending node [deg] | 358.527886 | ± 0.000097 |
| inclination [deg] | 146.715638 | ± 0.000144 |
| inverse semimajor axis [10-6 au-1] | 127.98 | ± 8.33 |