| Solar System Dynamics & Planetology Group |
|
C/1922 U1 Baade | |
| Solar System Dynamics & Planetology Group |
|
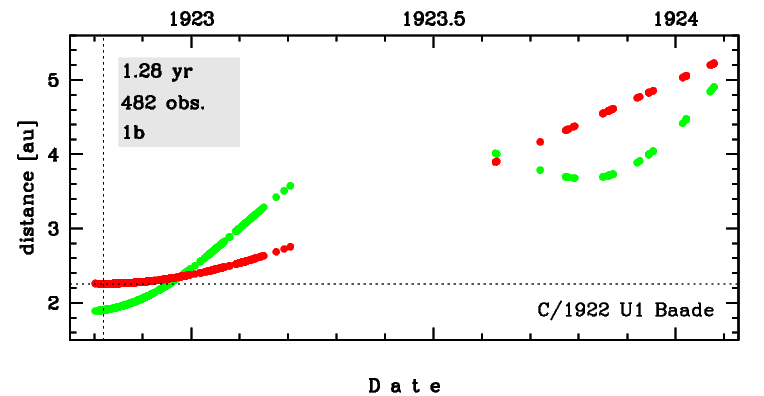
C/1922 U1 Baade | |
| number of observations | 482 |
| number of residuals | 826 |
| data interval | 1922 Oct. 19 — 1924 Jan. 28 |
| rms [arcsec] | 1.82 |
| orbit quality class | 1b |
| Epoch (TT) | 19221102.0 | = JD 2423360.5 |
| time of perihelion passage (TT) | 19221026.532142 | ± 0.001333 |
| perihelion distance | 2.25878685 | ± 0.00000759 |
| eccentricity | 1.00079818 | ± 0.00001927 |
| argument of perihelion [deg] | 118.298884 | ± 0.000483 |
| longitude of the ascending node [deg] | 221.578280 | ± 0.000054 |
| inclination [deg] | 51.456548 | ± 0.000036 |
| inverse semimajor axis [10-6 au-1] | -353.37 | ± 8.53 |
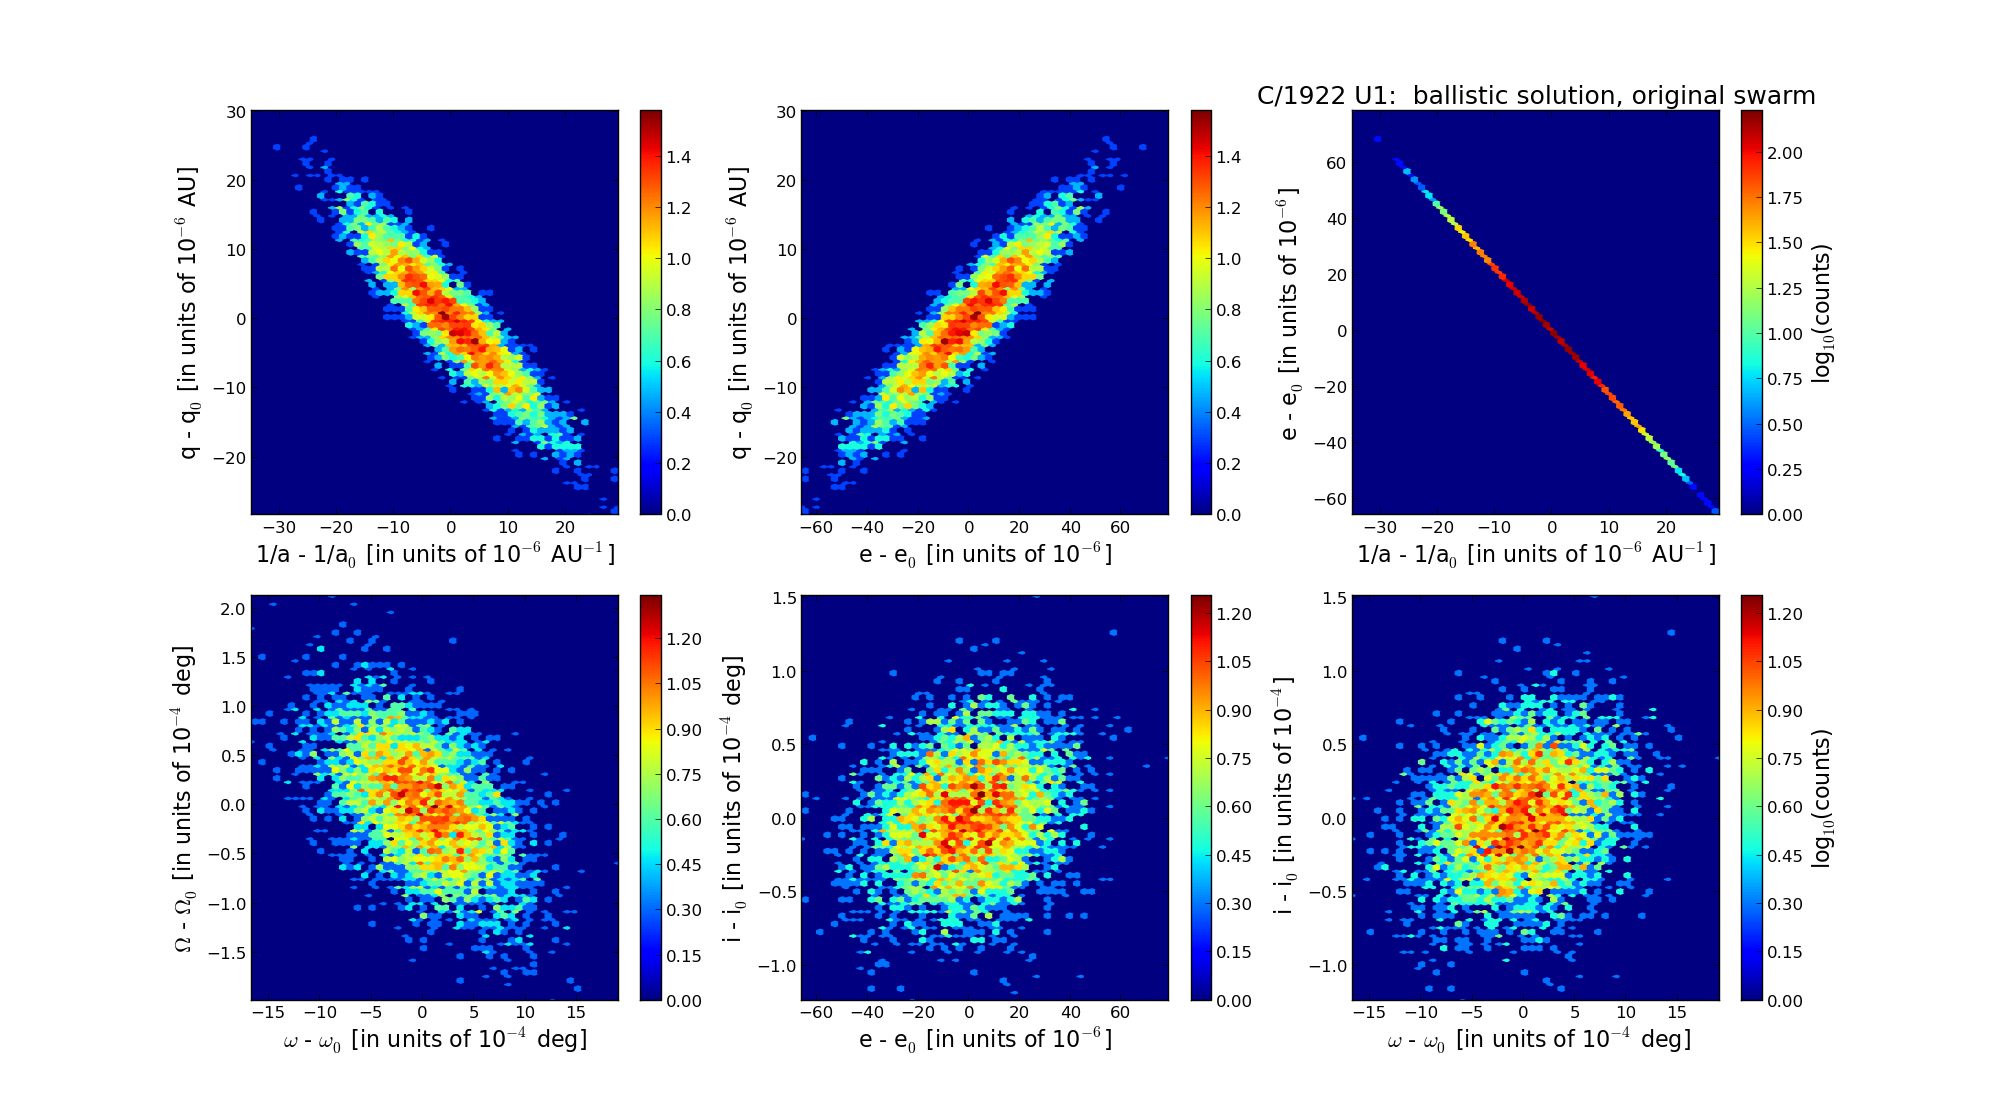
| Epoch (TT) | 16220607 | |
| time of perihelion passage (TT) | 19221025.586946 | ± 0.001413 |
| perihelion distance | 2.25655127 | ± 0.00000784 |
| eccentricity | 0.99999470 | ± 0.00001922 |
| argument of perihelion [deg] | 118.331242 | ± 0.000480 |
| longitude of the ascending node [deg] | 221.632968 | ± 0.000056 |
| inclination [deg] | 51.422827 | ± 0.000036 |
| inverse semimajor axis [10-6 au-1] | 2.35 | ± 8.52 |
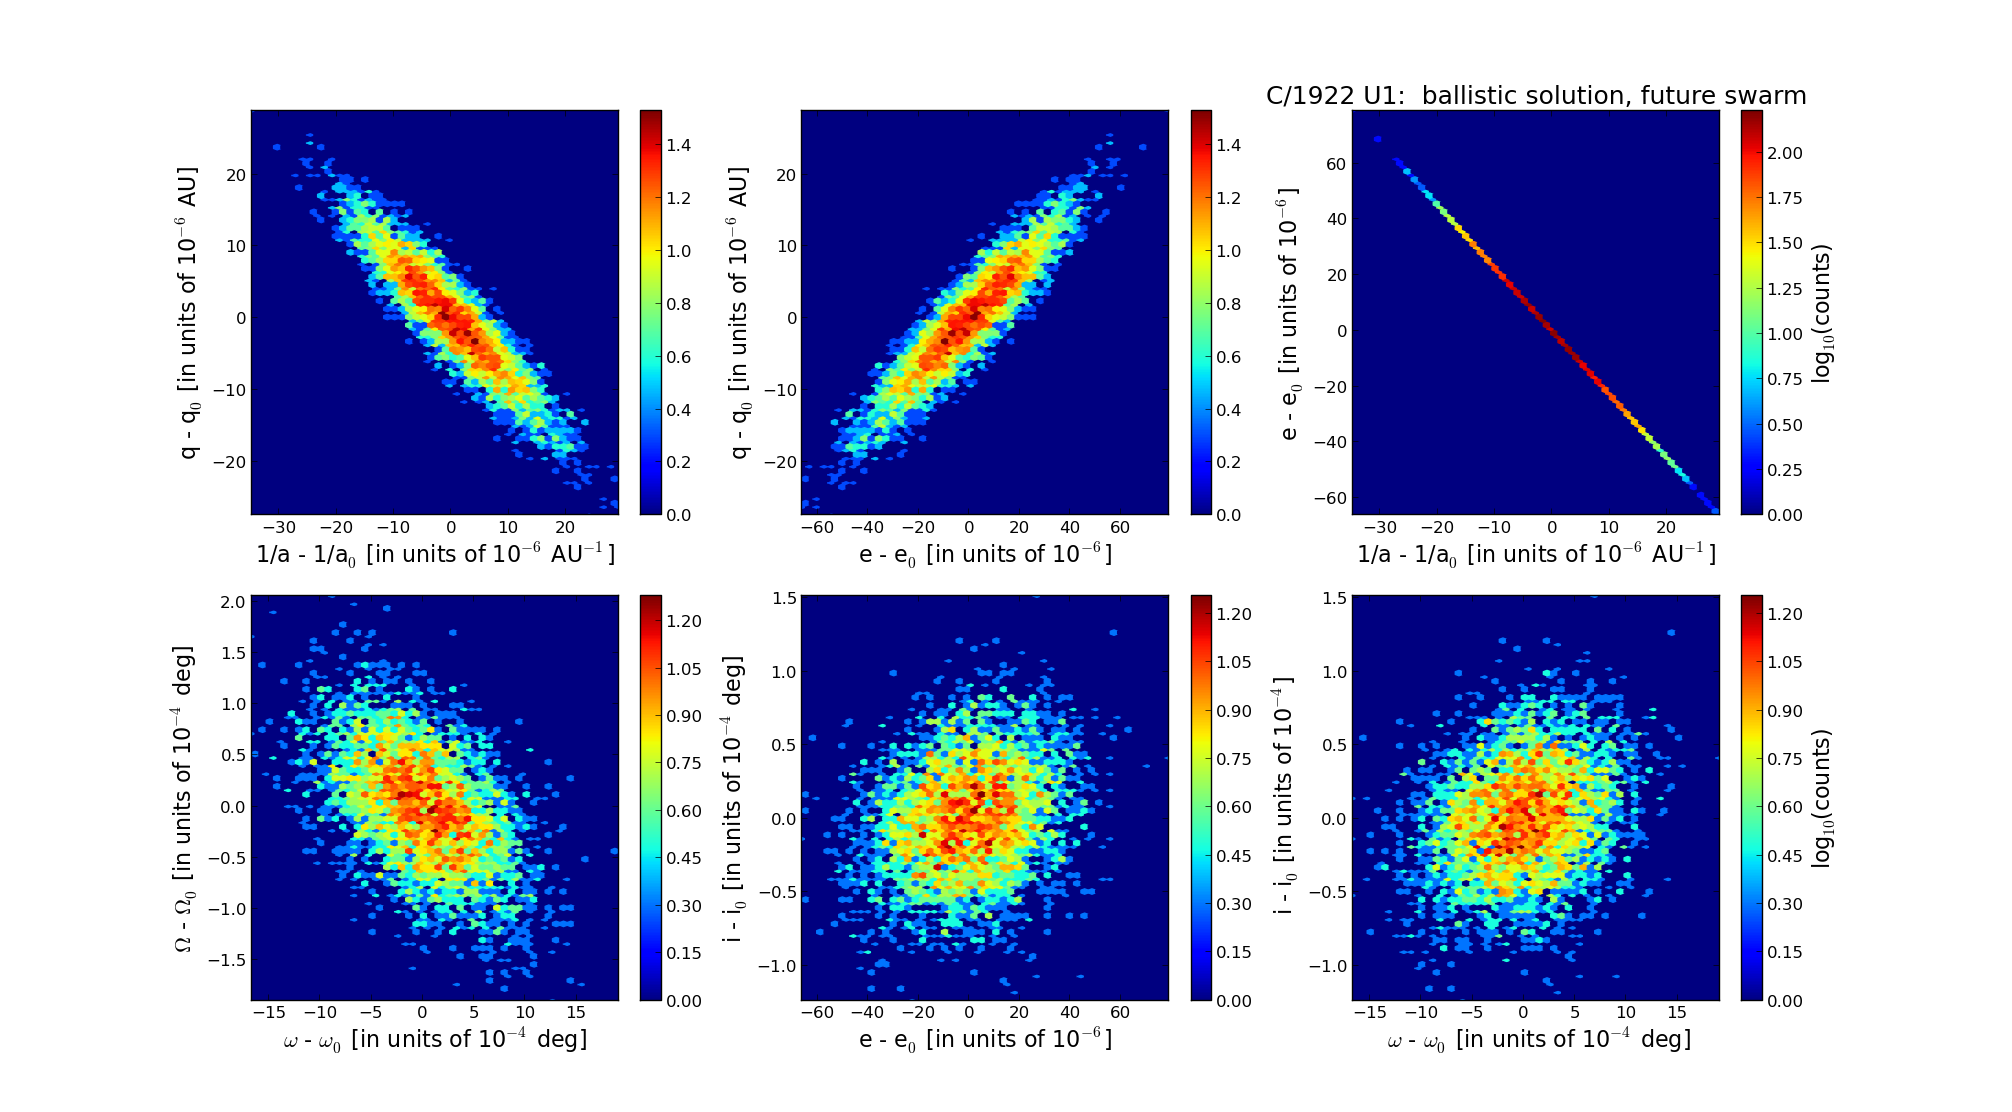
| Epoch (TT) | 22170320 | |
| time of perihelion passage (TT) | 19221026.356621 | ± 0.001274 |
| perihelion distance | 2.26579397 | ± 0.00000754 |
| eccentricity | 1.00122836 | ± 0.00001929 |
| argument of perihelion [deg] | 118.400924 | ± 0.000480 |
| longitude of the ascending node [deg] | 221.526423 | ± 0.000054 |
| inclination [deg] | 51.410666 | ± 0.000036 |
| inverse semimajor axis [10-6 au-1] | -542.13 | ± 8.51 |