| Solar System Dynamics & Planetology Group |
|
C/1914 M1 Neujmin | |
| Solar System Dynamics & Planetology Group |
|
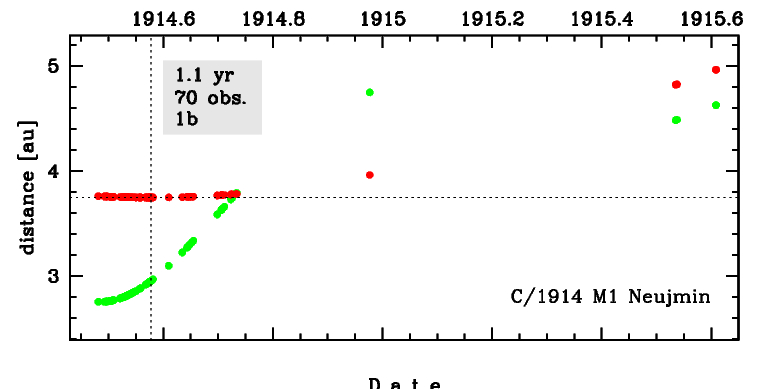
C/1914 M1 Neujmin | |
| number of observations | 70 |
| number of residuals | 122 |
| data interval | 1914 June 24 — 1915 Aug. 10 |
| rms [arcsec] | 2.21 |
| orbit quality class | 1b |
| Epoch (TT) | 19140816.0 | = JD 2420360.5 |
| time of perihelion passage (TT) | 19140730.491036 | ± 0.010771 |
| perihelion distance | 3.74680509 | ± 0.00006838 |
| eccentricity | 1.00325348 | ± 0.00009295 |
| argument of perihelion [deg] | 14.000020 | ± 0.002102 |
| longitude of the ascending node [deg] | 271.513791 | ± 0.000168 |
| inclination [deg] | 71.041017 | ± 0.000427 |
| inverse semimajor axis [10-6 au-1] | -868.34 | ± 24.78 |

| Epoch (TT) | 16110225 | |
| time of perihelion passage (TT) | 19140730.529118 | ± 0.010704 |
| perihelion distance | 3.74227102 | ± 0.00006815 |
| eccentricity | 0.99986307 | ± 0.00009345 |
| argument of perihelion [deg] | 14.115408 | ± 0.002096 |
| longitude of the ascending node [deg] | 271.473680 | ± 0.000169 |
| inclination [deg] | 71.078722 | ± 0.000424 |
| inverse semimajor axis [10-6 au-1] | 36.59 | ± 24.97 |
| Epoch (TT) | 22170827 | |
| time of perihelion passage (TT) | 19140730.313104 | ± 0.010831 |
| perihelion distance | 3.74262397 | ± 0.00006879 |
| eccentricity | 0.99996809 | ± 0.00009357 |
| argument of perihelion [deg] | 13.874513 | ± 0.002108 |
| longitude of the ascending node [deg] | 271.460496 | ± 0.000169 |
| inclination [deg] | 71.079539 | ± 0.000423 |
| inverse semimajor axis [10-6 au-1] | 8.53 | ± 25.00 |