| Solar System Dynamics & Planetology Group |
|
C/1912 R1 Gale | |
| Solar System Dynamics & Planetology Group |
|
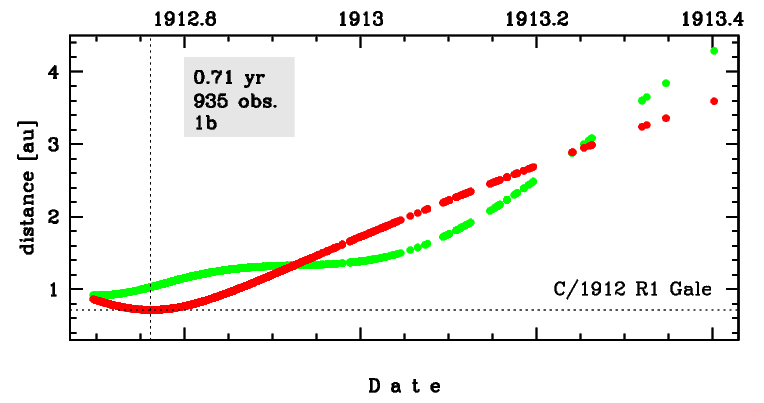
C/1912 R1 Gale | |
| number of observations | 935 |
| number of residuals | 1670 |
| data interval | 1912 Sep. 11 — 1913 May 26 |
| rms [arcsec] | 2.48 |
| orbit quality class | 1b |
| Epoch (TT) | 19121005.0 | = JD 2419680.5 |
| time of perihelion passage (TT) | 19121005.453192 | ± 0.000053 |
| perihelion distance | 0.71607473 | ± 0.00000084 |
| eccentricity | 1.00045667 | ± 0.00000377 |
| argument of perihelion [deg] | 25.621533 | ± 0.000108 |
| longitude of the ascending node [deg] | 298.246936 | ± 0.000110 |
| inclination [deg] | 79.809959 | ± 0.000085 |
| inverse semimajor axis [10-6 au-1] | -637.75 | ± 5.27 |
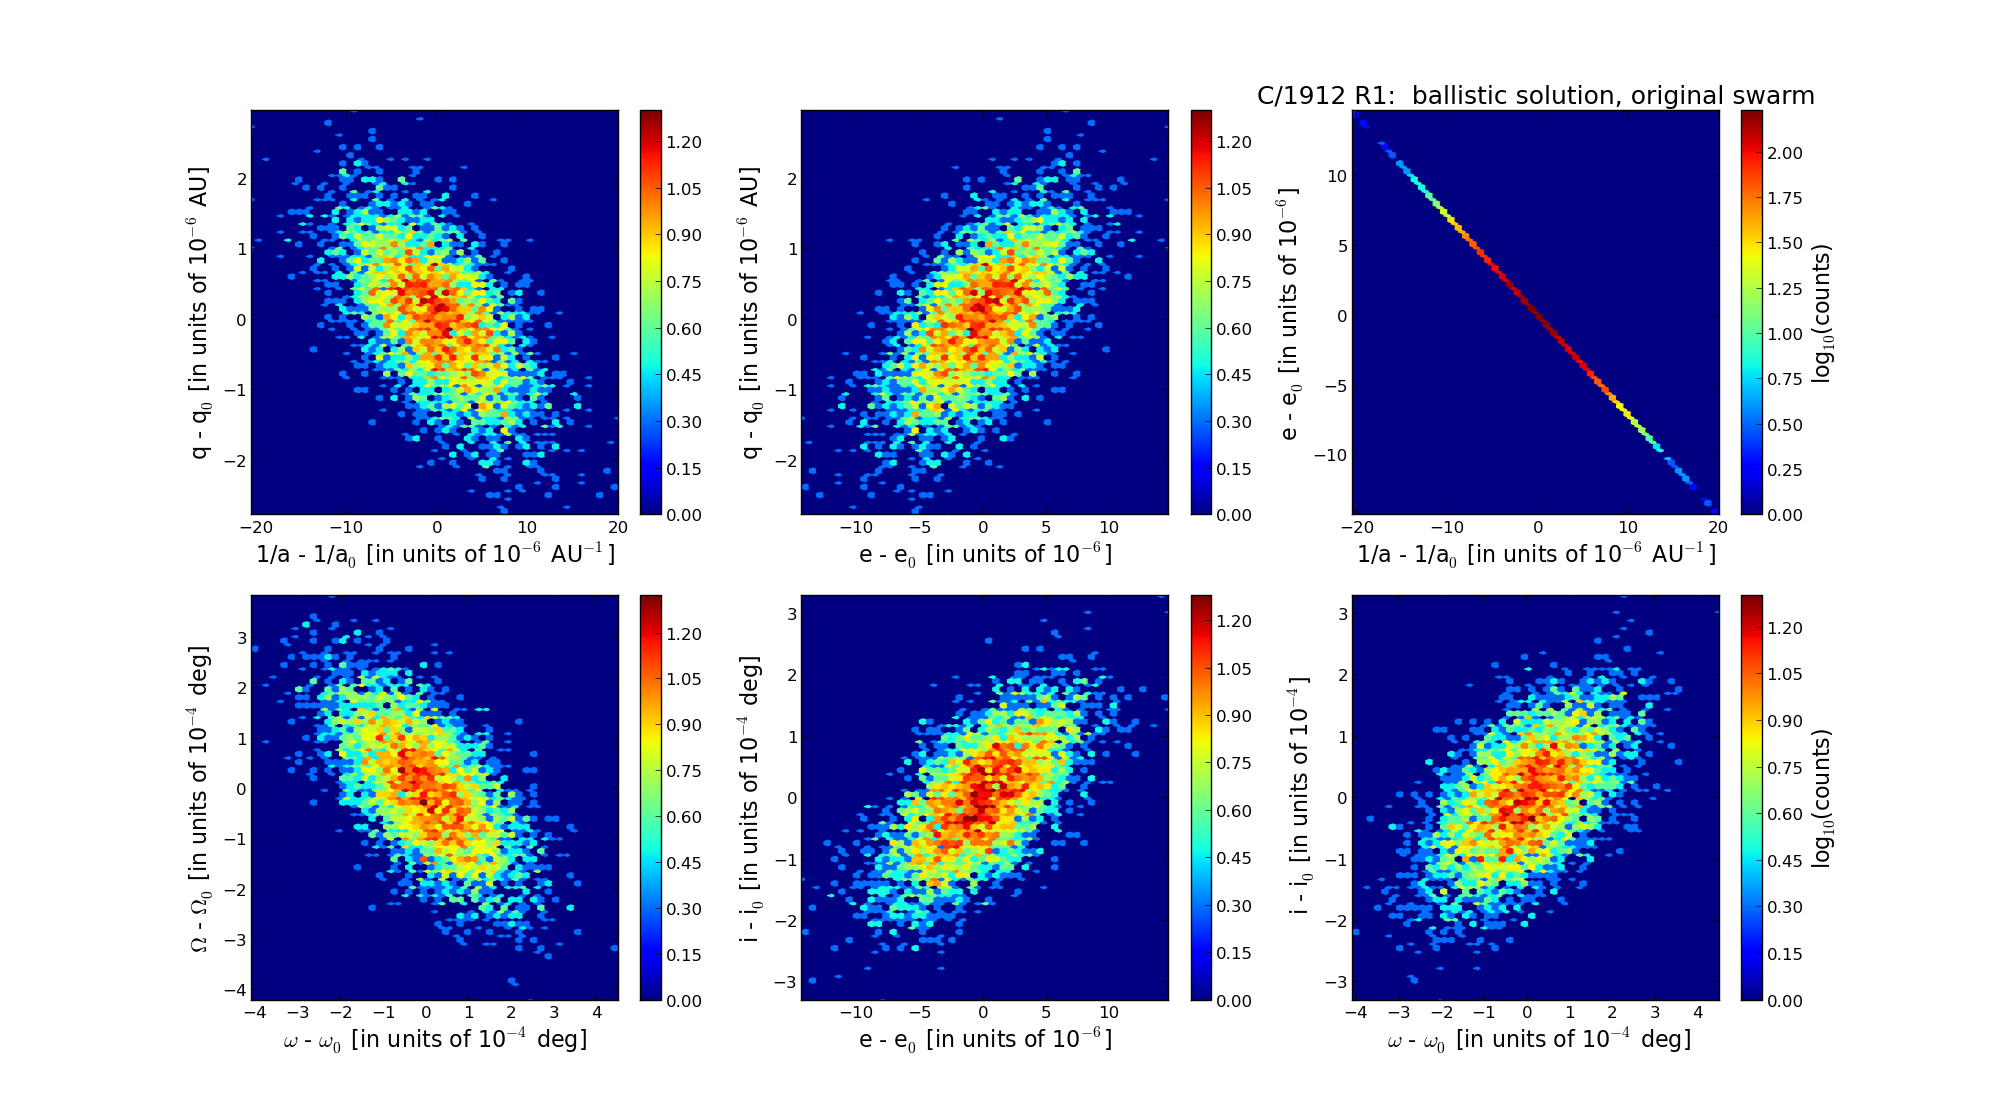
| Epoch (TT) | 16140828 | |
| time of perihelion passage (TT) | 19121004.999276 | ± 0.000056 |
| perihelion distance | 0.71382525 | ± 0.00000082 |
| eccentricity | 0.99997375 | ± 0.00000376 |
| argument of perihelion [deg] | 25.719944 | ± 0.000110 |
| longitude of the ascending node [deg] | 298.264840 | ± 0.000111 |
| inclination [deg] | 79.846805 | ± 0.000085 |
| inverse semimajor axis [10-6 au-1] | 36.77 | ± 5.27 |
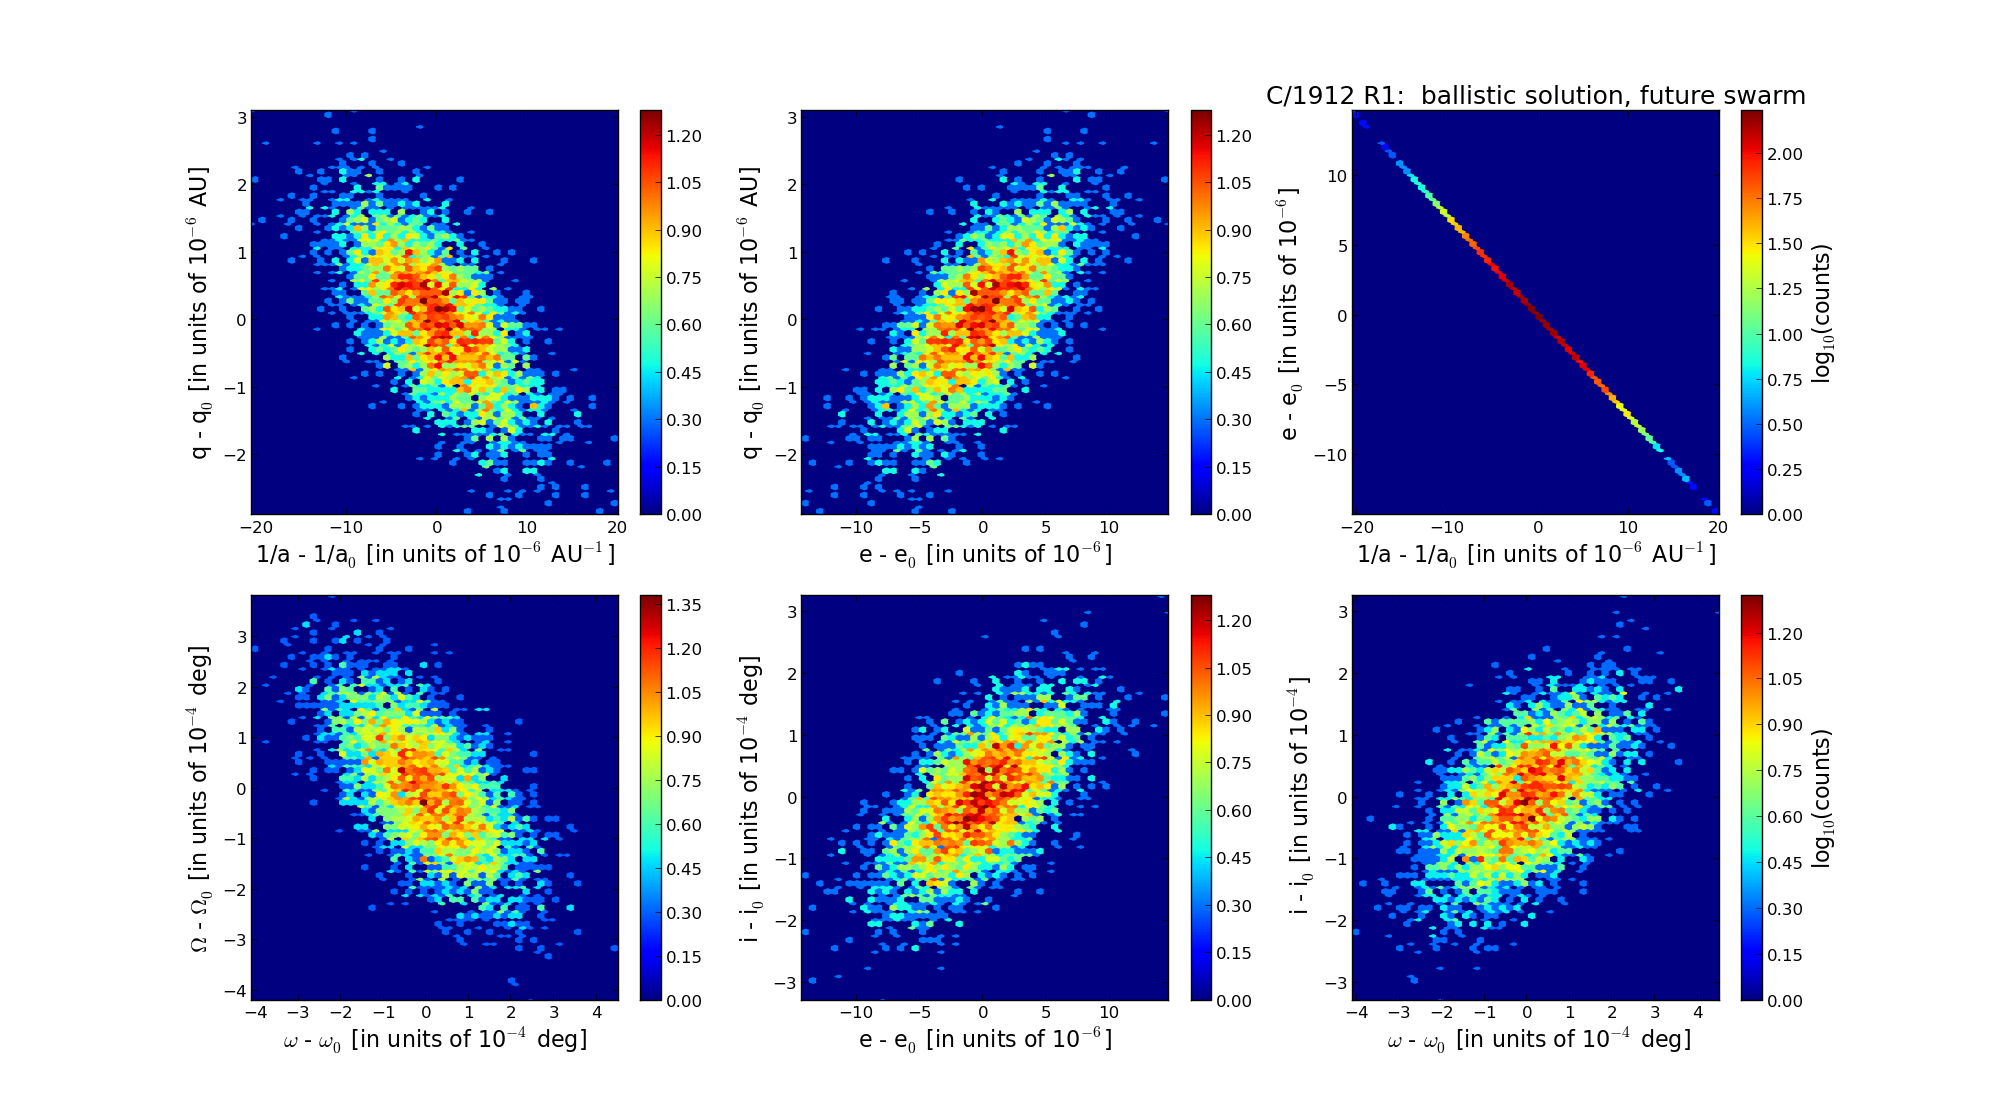
| Epoch (TT) | 22060517 | |
| time of perihelion passage (TT) | 19121005.284559 | ± 0.000055 |
| perihelion distance | 0.71584674 | ± 0.00000088 |
| eccentricity | 1.00026544 | ± 0.00000377 |
| argument of perihelion [deg] | 25.598506 | ± 0.000110 |
| longitude of the ascending node [deg] | 298.263151 | ± 0.000111 |
| inclination [deg] | 79.808281 | ± 0.000084 |
| inverse semimajor axis [10-6 au-1] | -370.81 | ± 5.27 |