| Solar System Dynamics & Planetology Group |
|
C/1902 X1 Giacobini | |
| Solar System Dynamics & Planetology Group |
|
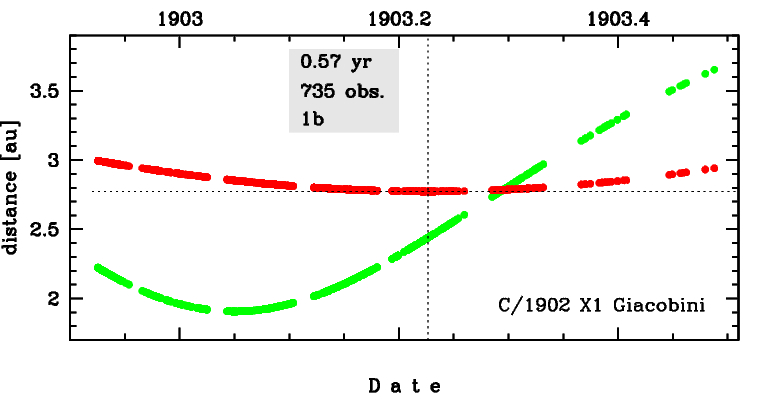
C/1902 X1 Giacobini | |
| number of observations | 735 |
| number of residuals | 1307 |
| data interval | 1902 Dec. 2 — 1903 June 27 |
| rms [arcsec] | 1.66 |
| orbit quality class | 1b |
| Epoch (TT) | 19030327.0 | = JD 2416200.5 |
| time of perihelion passage (TT) | 19030323.974159 | ± 0.002541 |
| perihelion distance | 2.77348499 | ± 0.00001328 |
| eccentricity | 1.00047034 | ± 0.00001976 |
| argument of perihelion [deg] | 5.830937 | ± 0.000781 |
| longitude of the ascending node [deg] | 118.810872 | ± 0.000085 |
| inclination [deg] | 43.894598 | ± 0.000258 |
| inverse semimajor axis [10-6 au-1] | -169.59 | ± 7.12 |
| Epoch (TT) | 16010128 | |
| time of perihelion passage (TT) | 19030324.059433 | ± 0.002493 |
| perihelion distance | 2.77648897 | ± 0.00001348 |
| eccentricity | 0.99979445 | ± 0.00002012 |
| argument of perihelion [deg] | 5.819304 | ± 0.000769 |
| longitude of the ascending node [deg] | 118.884571 | ± 0.000087 |
| inclination [deg] | 43.892926 | ± 0.000261 |
| inverse semimajor axis [10-6 au-1] | 74.03 | ± 7.25 |
| Epoch (TT) | 21990801 | |
| time of perihelion passage (TT) | 19030323.651406 | ± 0.002537 |
| perihelion distance | 2.78159684 | ± 0.00001339 |
| eccentricity | 1.00122340 | ± 0.00002014 |
| argument of perihelion [deg] | 5.932702 | ± 0.000770 |
| longitude of the ascending node [deg] | 118.796694 | ± 0.000085 |
| inclination [deg] | 43.858159 | ± 0.000262 |
| inverse semimajor axis [10-6 au-1] | -439.82 | ± 7.24 |