| Solar System Dynamics & Planetology Group |
|
C/1890 F1 Brooks | |
| Solar System Dynamics & Planetology Group |
|
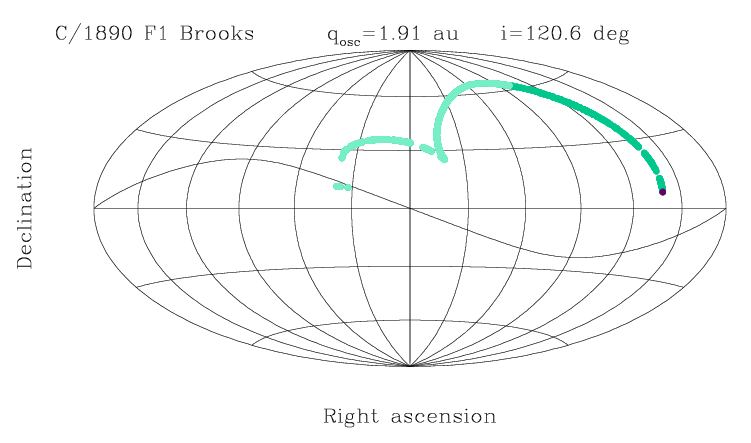
C/1890 F1 Brooks | |
| number of observations | 908 |
| number of residuals | 1644 |
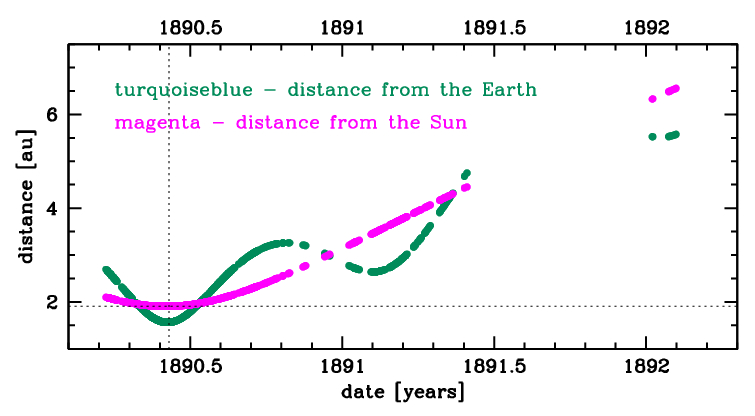
| data interval | 1890 Mar. 22 — 1892 Feb. 5 |
| rms [arcsec] | 2.61 |
| orbit quality class | 1a |
| Epoch (TT) | 18900602.0 | = JD 2411520.5 |
| time of perihelion passage (TT) | 18900602.037682 | ± 0.000236 |
| perihelion distance [au] | 1.90758152 | ± 0.00000173 |
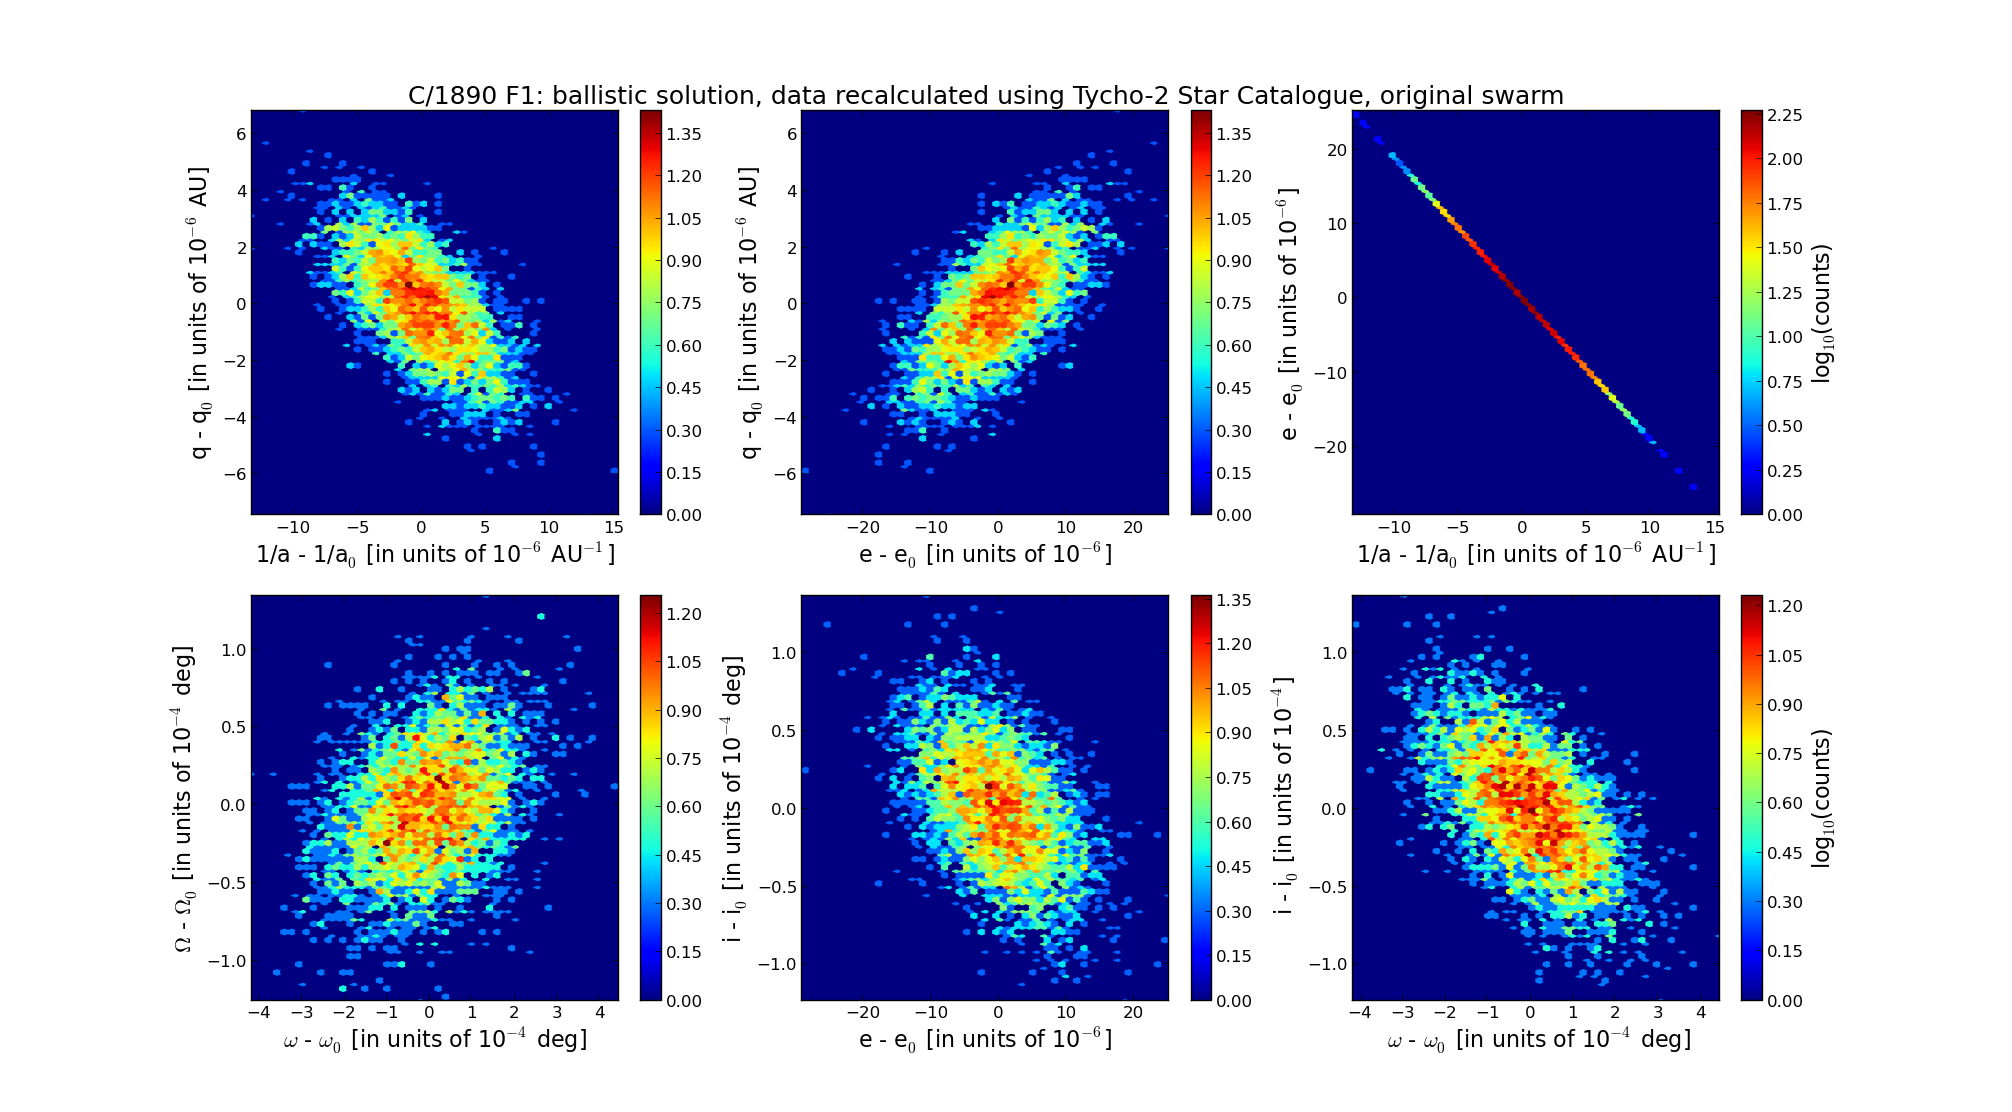
| eccentricity | 1.00033162 | ± 0.00000658 |
| argument of perihelion [deg] | 68.927751 | ± 0.000116 |
| longitude of the ascending node [deg] | 321.877680 | ± 0.000037 |
| inclination [deg] | 120.568896 | ± 0.000037 |
| inverse semimajor axis [10-6 au-1] | -173.84 | ± 3.45 |
| Epoch (TT) | 15900106 | |
| time of perihelion passage (TT) | 18900601.440026 | ± 0.000267 |
| perihelion distance [au] | 1.90269415 | ± 0.00000172 |
| eccentricity | 0.99989655 | ± 0.00000651 |
| argument of perihelion [deg] | 69.063223 | ± 0.000115 |
| longitude of the ascending node [deg] | 321.902338 | ± 0.000037 |
| inclination [deg] | 120.564184 | ± 0.000037 |
| inverse semimajor axis [10-6 au-1] | 54.37 | ± 3.42 |

| Epoch (TT) | 21910224 | |
| time of perihelion passage (TT) | 18900602.517267 | ± 0.000205 |
| perihelion distance [au] | 1.90422364 | ± 0.00000174 |
| eccentricity | 0.99982638 | ± 0.00000651 |
| argument of perihelion [deg] | 68.848991 | ± 0.000115 |
| longitude of the ascending node [deg] | 321.904687 | ± 0.000037 |
| inclination [deg] | 120.537491 | ± 0.000037 |
| inverse semimajor axis [10-6 au-1] | 91.18 | ± 3.42 |