| Solar System Dynamics & Planetology Group |
|
C/2009 P2 Boattini | |
| Solar System Dynamics & Planetology Group |
|
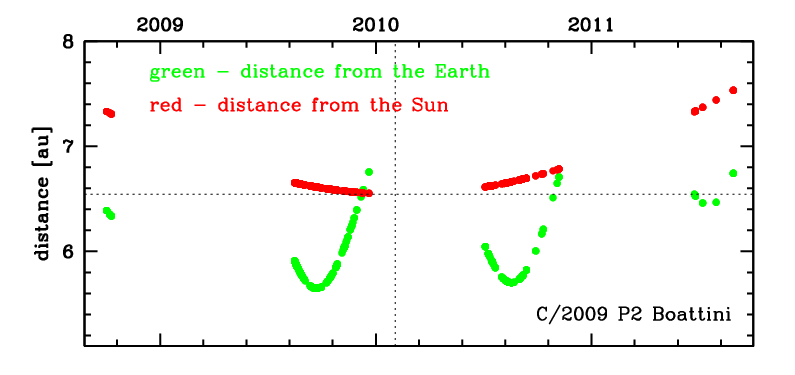
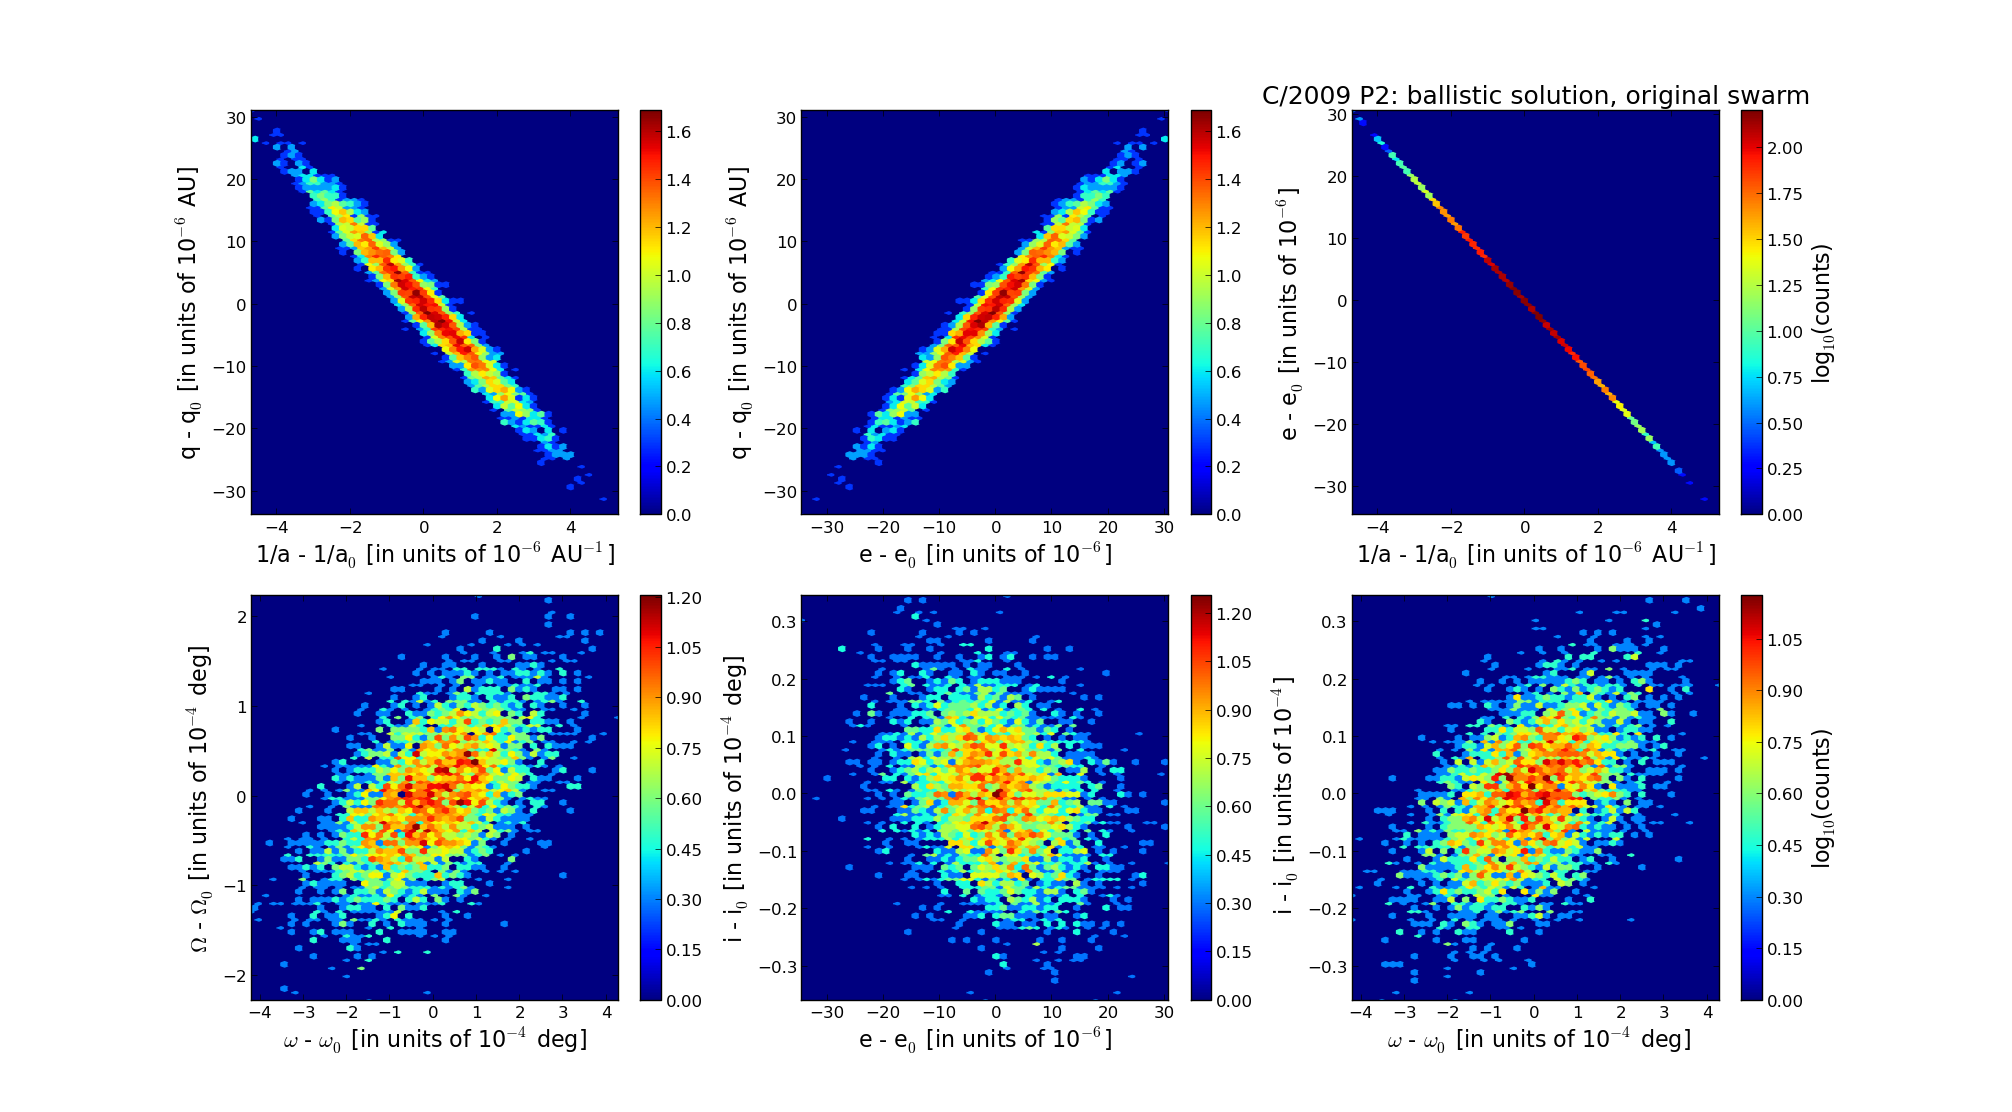
C/2009 P2 Boattini | |
| number of observations | 503 |
| number of residuals | 982 |
| data interval | 2008 Oct. 1 — 2011 Aug. 27 |
| rms [arcsec] | 0.51 |
| orbit quality class | 1a |
| Epoch (TT) | 20100213.0 | = JD 2455240.5 |
| time of perihelion passage (TT) | 20100210.863085 | ± 0.001278 |
| perihelion distance | 6.54387710 | ± 0.00000891 |
| eccentricity | 1.00183747 | ± 0.00000903 |
| argument of perihelion [deg] | 76.088005 | ± 0.000124 |
| longitude of the ascending node [deg] | 60.392108 | ± 0.000066 |
| inclination [deg] | 163.455157 | ± 0.000011 |
| inverse semimajor axis [10-6 au-1] | -280.79 | ± 1.38 |
| Epoch (TT) | 17020119 | |
| time of perihelion passage (TT) | 20100211.788872 | ± 0.001311 |
| perihelion distance | 6.54119059 | ± 0.00000894 |
| eccentricity | 0.99986297 | ± 0.00000906 |
| argument of perihelion [deg] | 76.054900 | ± 0.000126 |
| longitude of the ascending node [deg] | 60.336867 | ± 0.000066 |
| inclination [deg] | 163.445524 | ± 0.000011 |
| inverse semimajor axis [10-6 au-1] | 20.95 | ± 1.38 |
| Epoch (TT) | 23180709 | |
| time of perihelion passage (TT) | 20100210.745514 | ± 0.001296 |
| perihelion distance | 6.54247976 | ± 0.00000888 |
| eccentricity | 0.99968814 | ± 0.00000906 |
| argument of perihelion [deg] | 76.230546 | ± 0.000126 |
| longitude of the ascending node [deg] | 60.497239 | ± 0.000066 |
| inclination [deg] | 163.451272 | ± 0.000011 |
| inverse semimajor axis [10-6 au-1] | 47.67 | ± 1.39 |