| Solar System Dynamics & Planetology Group |
|
C/2003 S3 LINEAR | |
| Solar System Dynamics & Planetology Group |
|
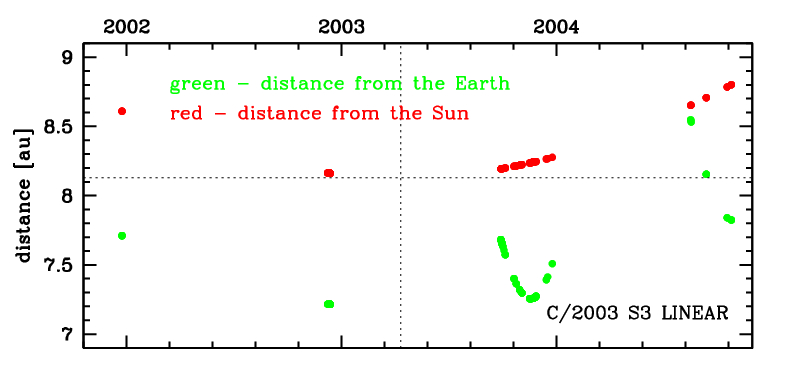
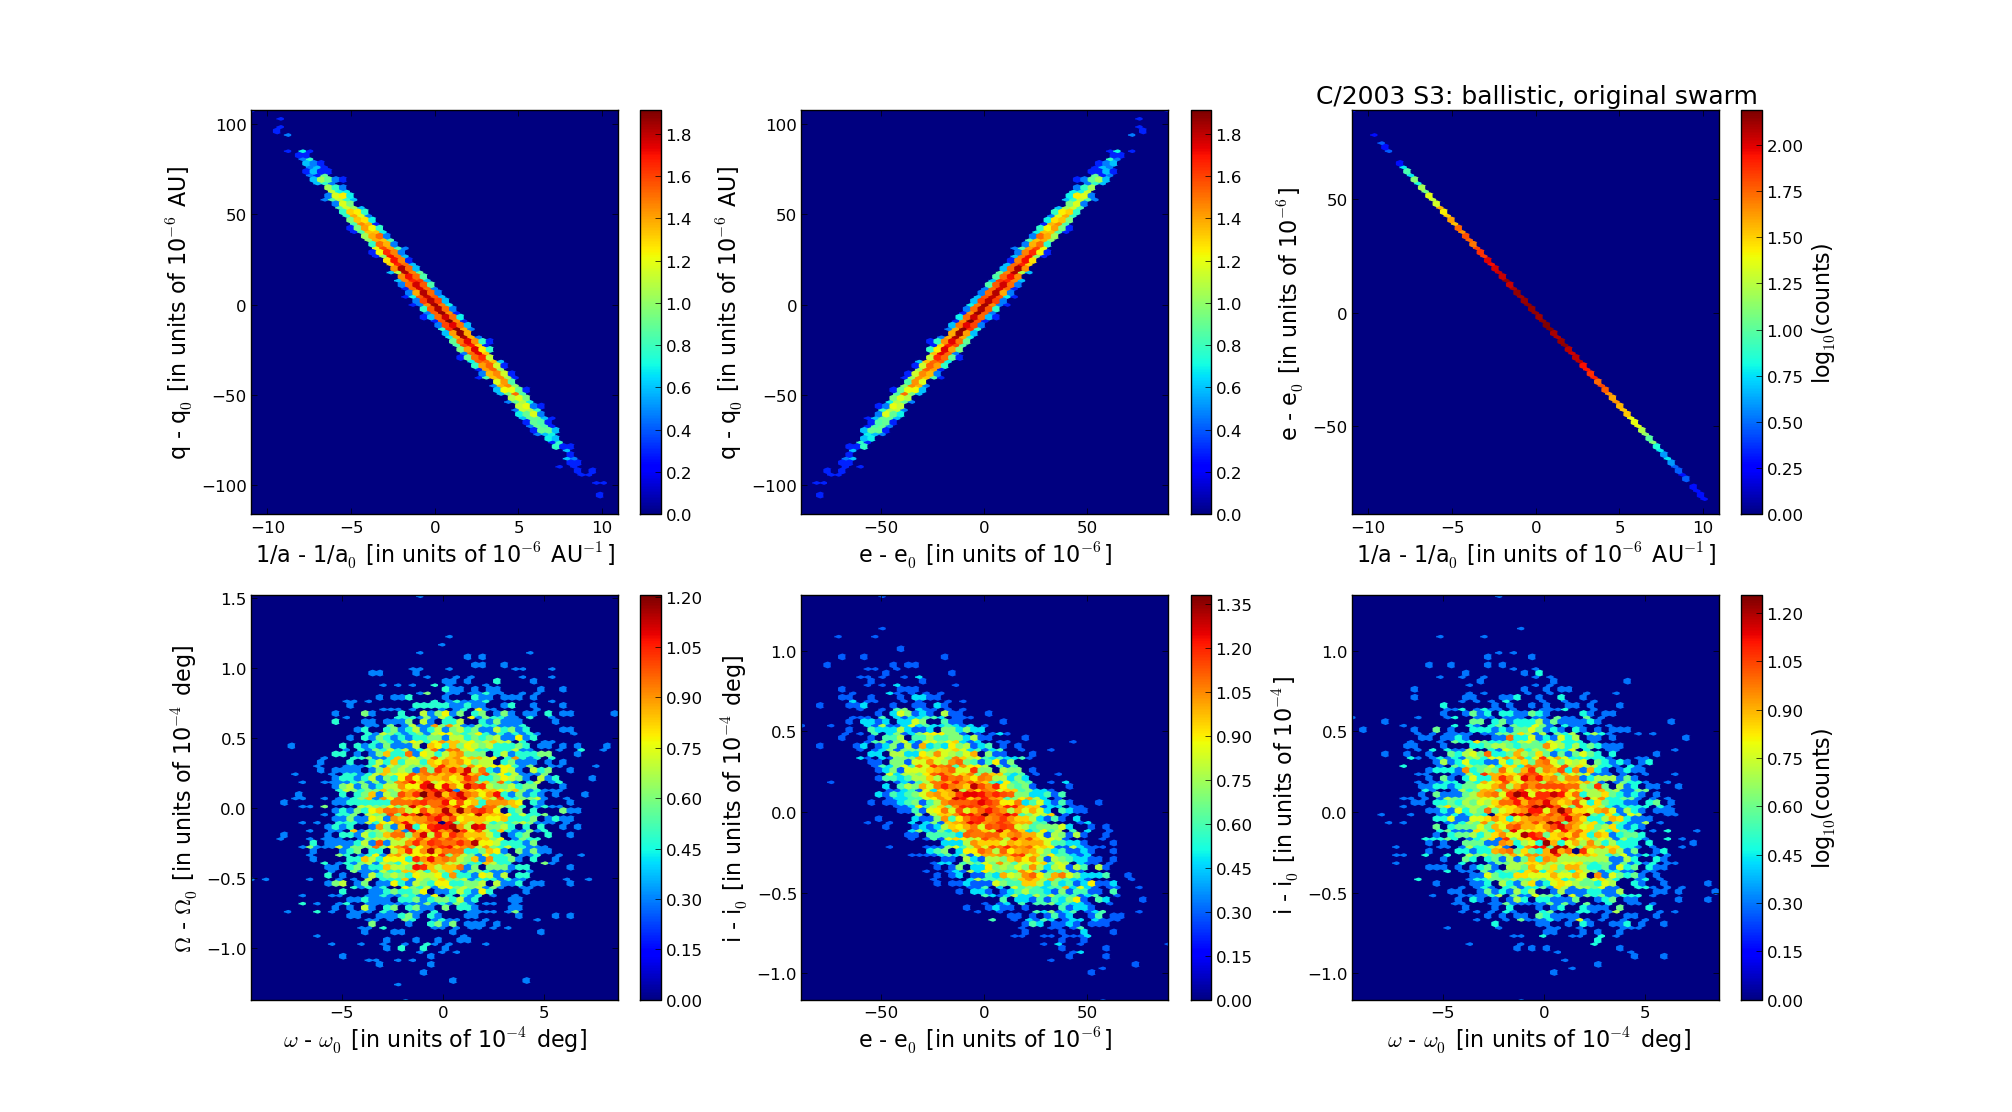
C/2003 S3 LINEAR | |
| number of observations | 124 |
| number of residuals | 242 |
| data interval | 2001 Dec. 23 — 2004 Oct. 23 |
| rms [arcsec] | 0.49 |
| orbit quality class | 1a |
| Epoch (TT) | 20030322.0 | = JD 2452720.5 |
| time of perihelion passage (TT) | 20030410.253543 | ± 0.004094 |
| perihelion distance | 8.12943090 | ± 0.00003043 |
| eccentricity | 1.00142723 | ± 0.00002358 |
| argument of perihelion [deg] | 154.553947 | ± 0.000233 |
| longitude of the ascending node [deg] | 226.389152 | ± 0.000035 |
| inclination [deg] | 151.496771 | ± 0.000029 |
| inverse semimajor axis [10-6 au-1] | -175.56 | ± 2.90 |
| Epoch (TT) | 16920530 | |
| time of perihelion passage (TT) | 20030409.093744 | ± 0.004294 |
| perihelion distance | 8.12669499 | ± 0.00003132 |
| eccentricity | 0.99971781 | ± 0.00002426 |
| argument of perihelion [deg] | 154.380377 | ± 0.000246 |
| longitude of the ascending node [deg] | 226.284679 | ± 0.000037 |
| inclination [deg] | 151.518010 | ± 0.000030 |
| inverse semimajor axis [10-6 au-1] | 34.72 | ± 2.99 |
| Epoch (TT) | 23130804 | |
| time of perihelion passage (TT) | 20030408.011228 | ± 0.004310 |
| perihelion distance | 8.12368438 | ± 0.00003134 |
| eccentricity | 1.00005949 | ± 0.00002426 |
| argument of perihelion [deg] | 154.403211 | ± 0.000245 |
| longitude of the ascending node [deg] | 226.380197 | ± 0.000036 |
| inclination [deg] | 151.491334 | ± 0.000030 |
| inverse semimajor axis [10-6 au-1] | -7.32 | ± 2.99 |