| Solar System Dynamics & Planetology Group |
|
C/1993 K1 Shoemaker-Levy | |
| Solar System Dynamics & Planetology Group |
|
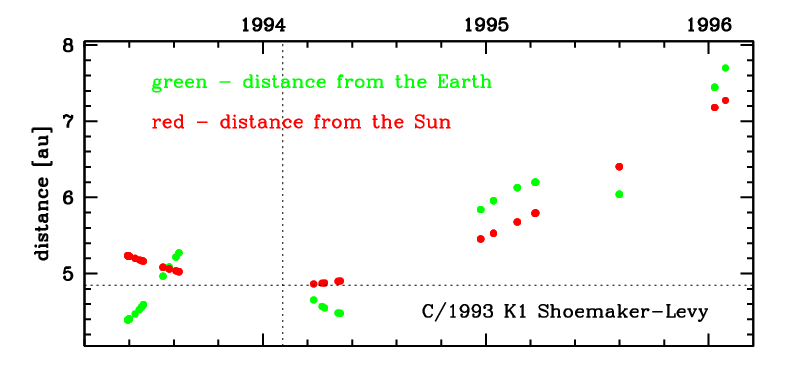
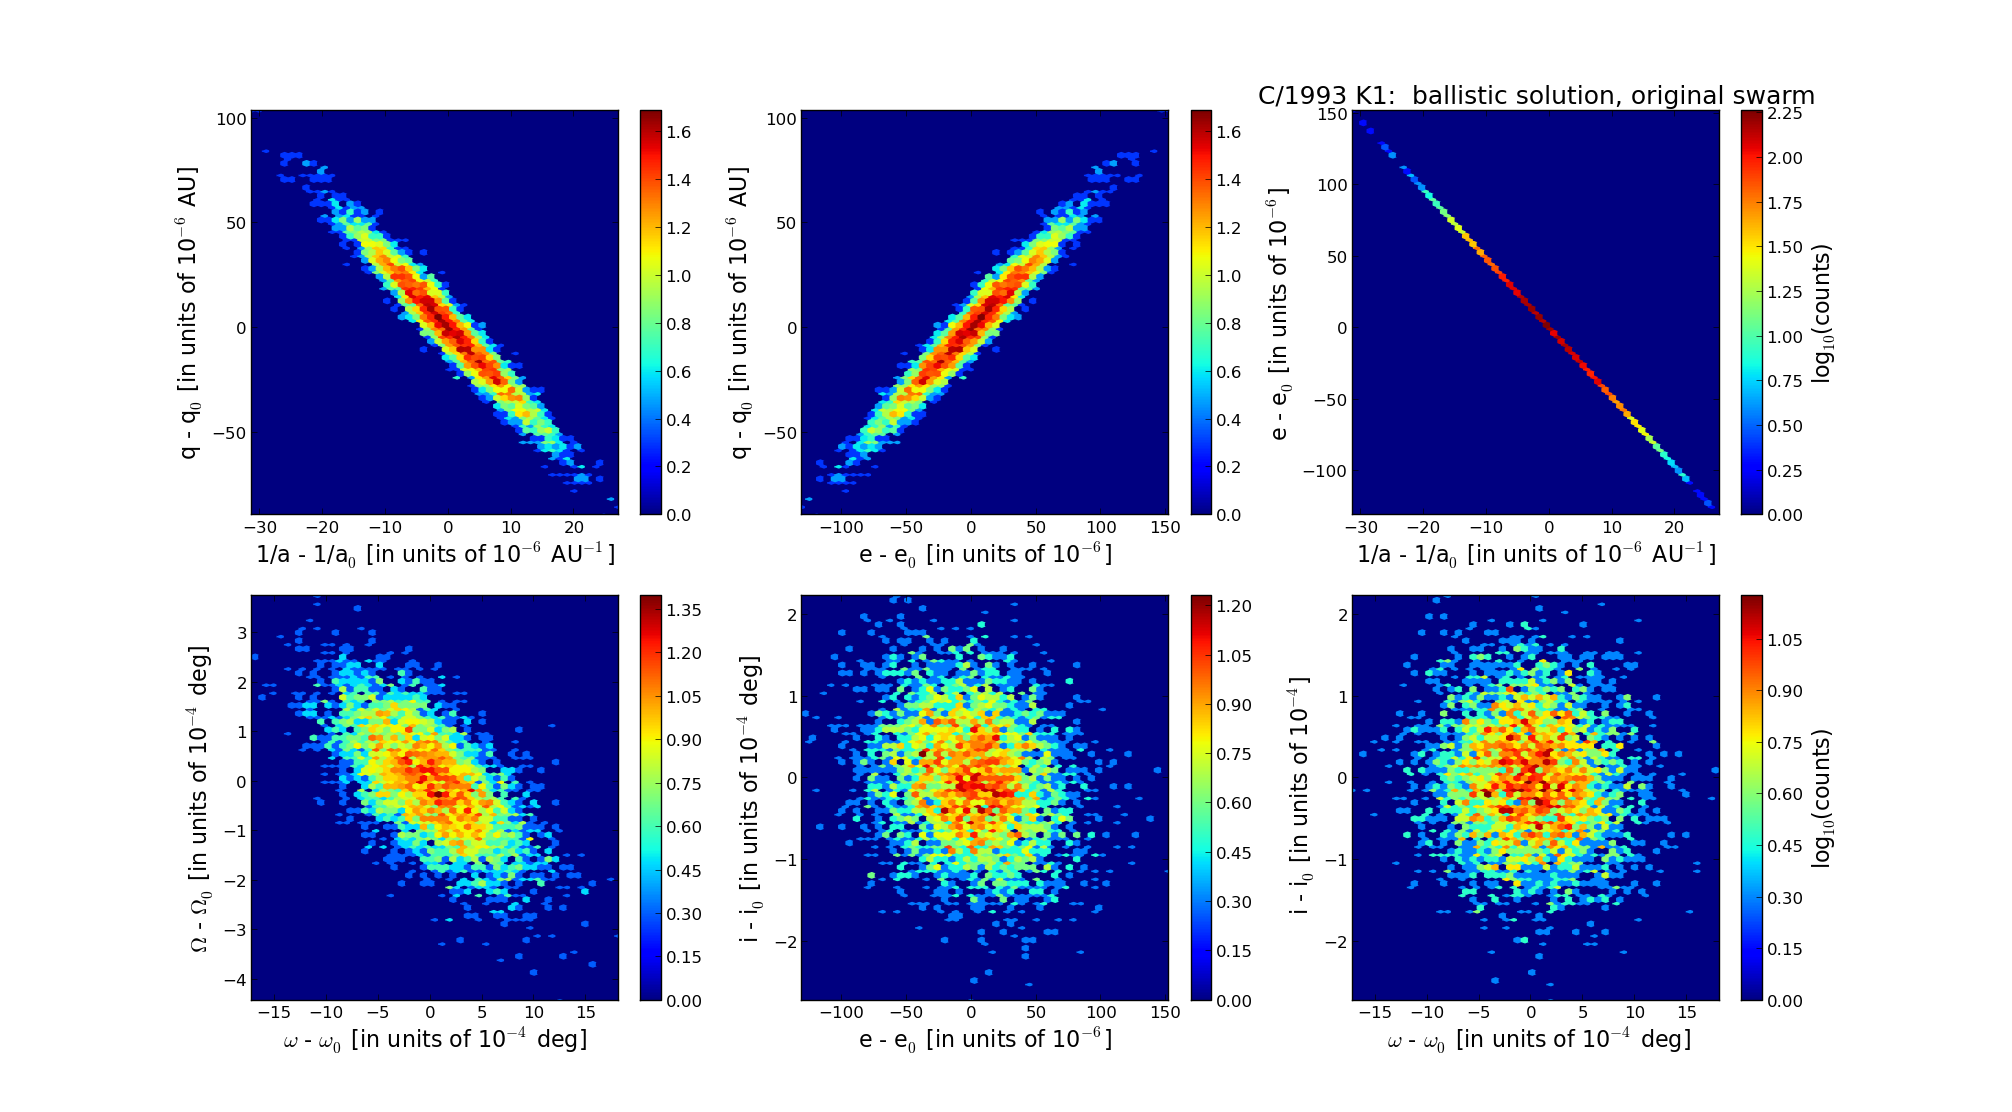
C/1993 K1 Shoemaker-Levy | |
| number of observations | 44 |
| number of residuals | 86 |
| data interval | 1993 May 23 — 1996 Jan. 27 |
| rms [arcsec] | 1.02 |
| orbit quality class | 1a |
| Epoch (TT) | 19940217.0 | = JD 2449400.5 |
| time of perihelion passage (TT) | 19940201.947760 | ± 0.003910 |
| perihelion distance | 4.84927746 | ± 0.00002489 |
| eccentricity | 1.00023279 | ± 0.00003717 |
| argument of perihelion [deg] | 232.445275 | ± 0.000466 |
| longitude of the ascending node [deg] | 30.328581 | ± 0.000102 |
| inclination [deg] | 67.766928 | ± 0.000070 |
| inverse semimajor axis [10-6 au-1] | -48.01 | ± 7.66 |
| Epoch (TT) | 16881127 | |
| time of perihelion passage (TT) | 19940131.665129 | ± 0.003962 |
| perihelion distance | 4.84471237 | ± 0.00002505 |
| eccentricity | 0.99985892 | ± 0.00003712 |
| argument of perihelion [deg] | 232.436917 | ± 0.000468 |
| longitude of the ascending node [deg] | 30.322178 | ± 0.000103 |
| inclination [deg] | 67.735390 | ± 0.000070 |
| inverse semimajor axis [10-6 au-1] | 29.12 | ± 7.66 |
| Epoch (TT) | 23060403 | |
| time of perihelion passage (TT) | 19940201.616244 | ± 0.003885 |
| perihelion distance | 4.84606419 | ± 0.00002497 |
| eccentricity | 0.99711750 | ± 0.00003713 |
| argument of perihelion [deg] | 232.375367 | ± 0.000468 |
| longitude of the ascending node [deg] | 30.352470 | ± 0.000102 |
| inclination [deg] | 67.825586 | ± 0.000070 |
| inverse semimajor axis [10-6 au-1] | 594.81 | ± 7.66 |