| Solar System Dynamics & Planetology Group |
|
C/1993 F1 Mueller | |
| Solar System Dynamics & Planetology Group |
|
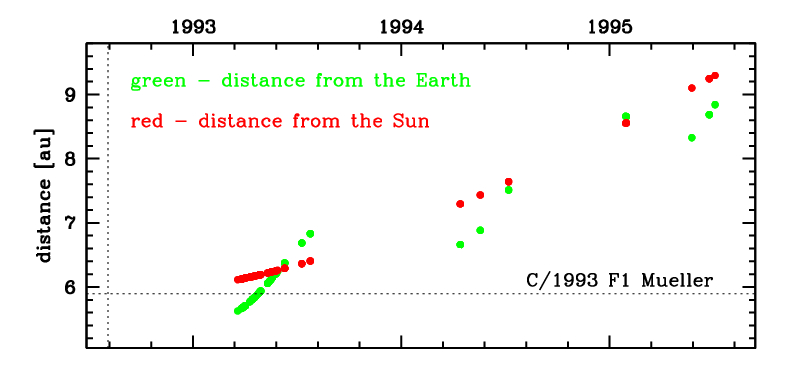
C/1993 F1 Mueller | |
| number of observations | 111 |
| number of residuals | 219 |
| data interval | 1993 Mar. 19 — 1995 July 4 |
| rms [arcsec] | 1.11 |
| orbit quality class | 1a |
| Epoch (TT) | 19920806.0 | = JD 2448840.5 |
| time of perihelion passage (TT) | 19920804.502761 | ± 0.010589 |
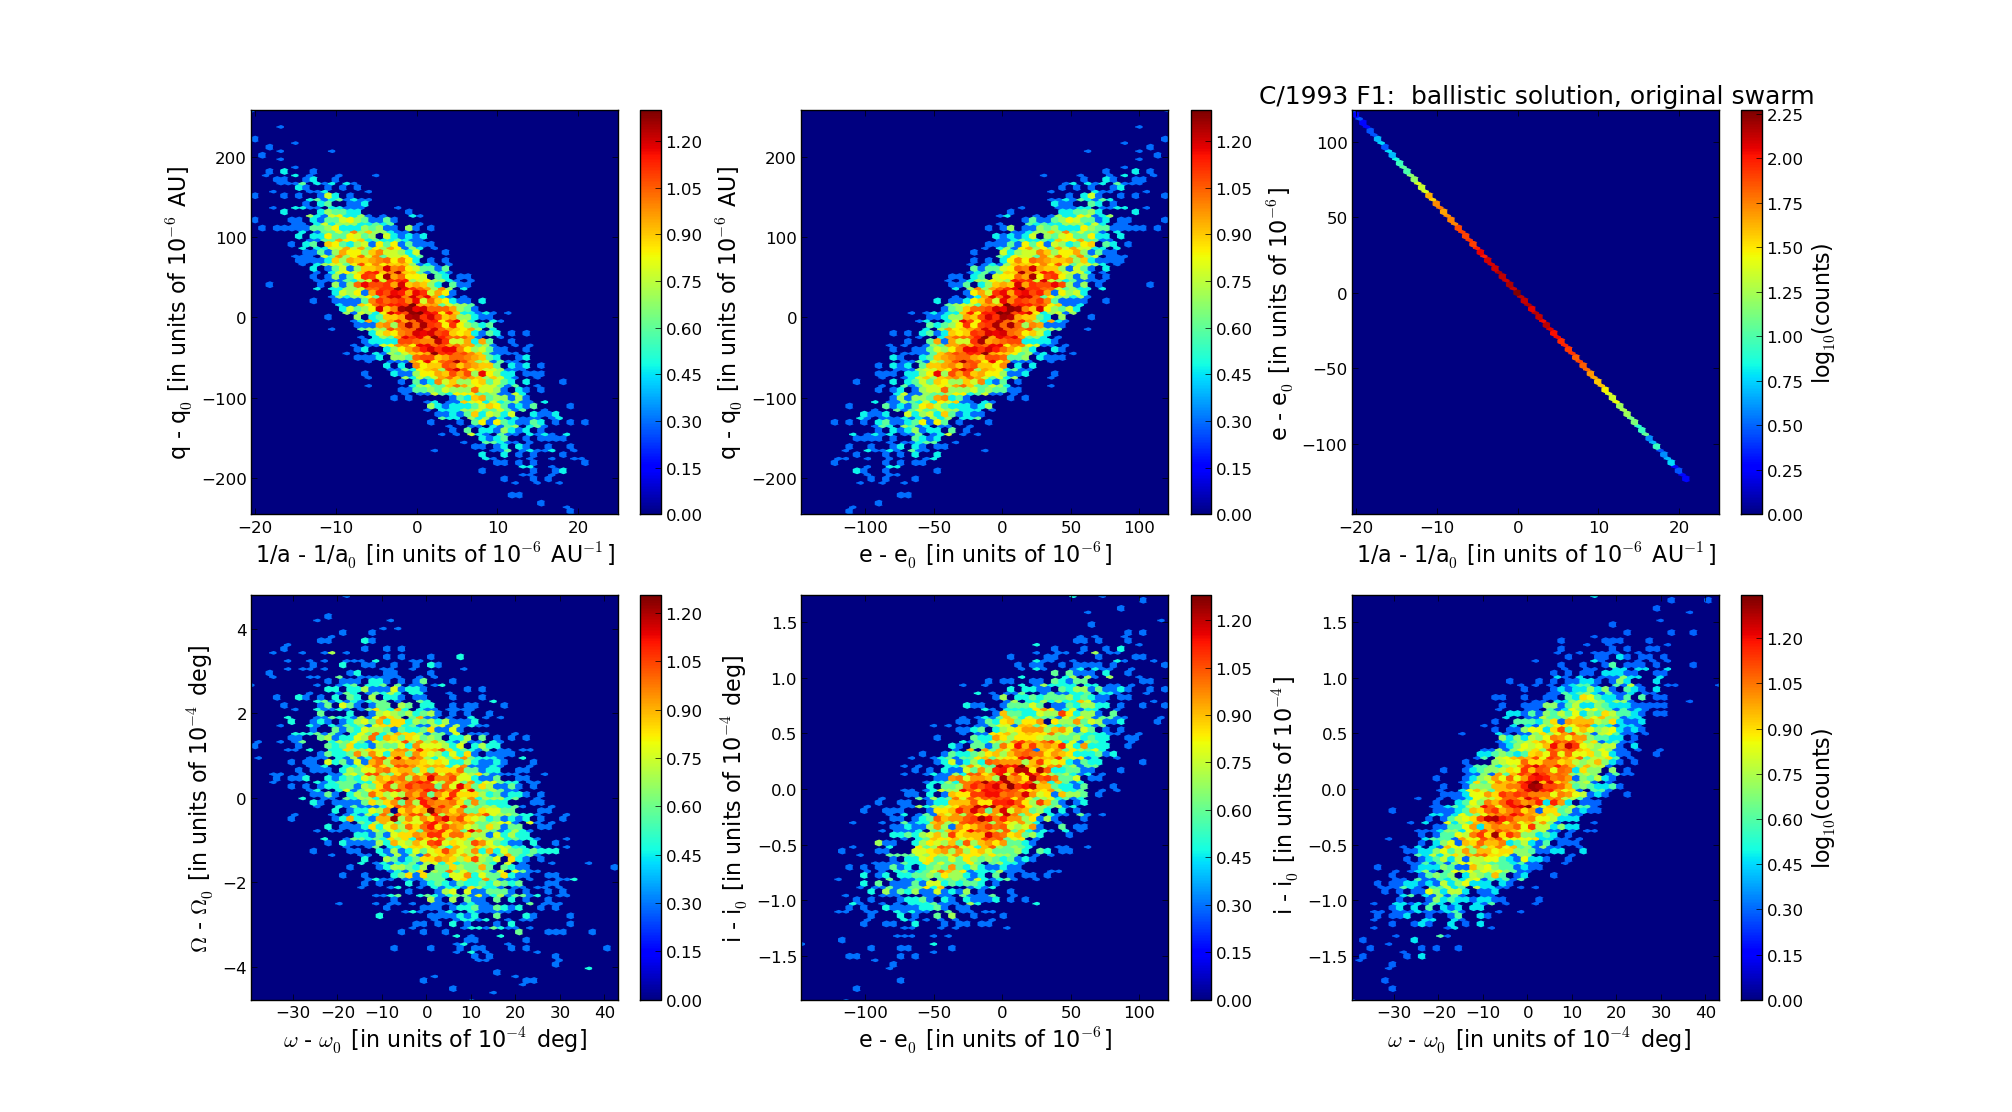
| perihelion distance | 5.90039749 | ± 0.00006949 |
| eccentricity | 1.00574936 | ± 0.00003689 |
| argument of perihelion [deg] | 61.992684 | ± 0.001170 |
| longitude of the ascending node [deg] | 77.515654 | ± 0.000132 |
| inclination [deg] | 53.940015 | ± 0.000051 |
| inverse semimajor axis [10-6 au-1] | -974.40 | ± 6.22 |
| Epoch (TT) | 16850308 | |
| time of perihelion passage (TT) | 19920806.153786 | ± 0.010511 |
| perihelion distance | 5.89949798 | ± 0.00006956 |
| eccentricity | 0.99963062 | ± 0.00003712 |
| argument of perihelion [deg] | 62.056088 | ± 0.001154 |
| longitude of the ascending node [deg] | 77.524079 | ± 0.000133 |
| inclination [deg] | 53.980307 | ± 0.000050 |
| inverse semimajor axis [10-6 au-1] | 62.61 | ± 6.29 |
| Epoch (TT) | 22950311 | |
| time of perihelion passage (TT) | 19920805.102586 | ± 0.010526 |
| perihelion distance | 5.89952519 | ± 0.00006916 |
| eccentricity | 1.00209959 | ± 0.00003704 |
| argument of perihelion [deg] | 61.996503 | ± 0.001165 |
| longitude of the ascending node [deg] | 77.463429 | ± 0.000132 |
| inclination [deg] | 53.959731 | ± 0.000050 |
| inverse semimajor axis [10-6 au-1] | -355.89 | ± 6.27 |