| Solar System Dynamics & Planetology Group |
|
C/1988 B1 Shoemaker | |
| Solar System Dynamics & Planetology Group |
|
C/1988 B1 Shoemaker | |
| number of observations | 66 |
| number of residuals | 127 |
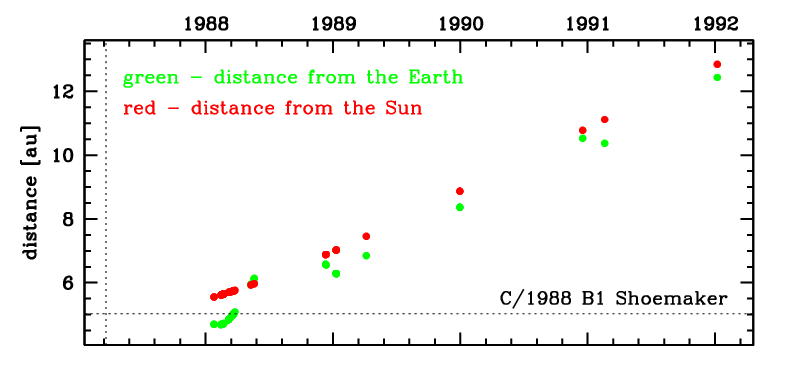
| data interval | 1988 Jan. 23 — 1992 Jan. 6 |
| rms [arcsec] | 0.98 |
| orbit quality class | 1a |
| Epoch (TT) | 19870326.0 | = JD 2446880.5 |
| time of perihelion passage (TT) | 19870320.107555 | ± 0.009206 |
| perihelion distance | 5.03070649 | ± 0.00007222 |
| eccentricity | 1.00248504 | ± 0.00003544 |
| argument of perihelion [deg] | 124.217043 | ± 0.001331 |
| longitude of the ascending node [deg] | 325.159660 | ± 0.000038 |
| inclination [deg] | 80.585940 | ± 0.000139 |
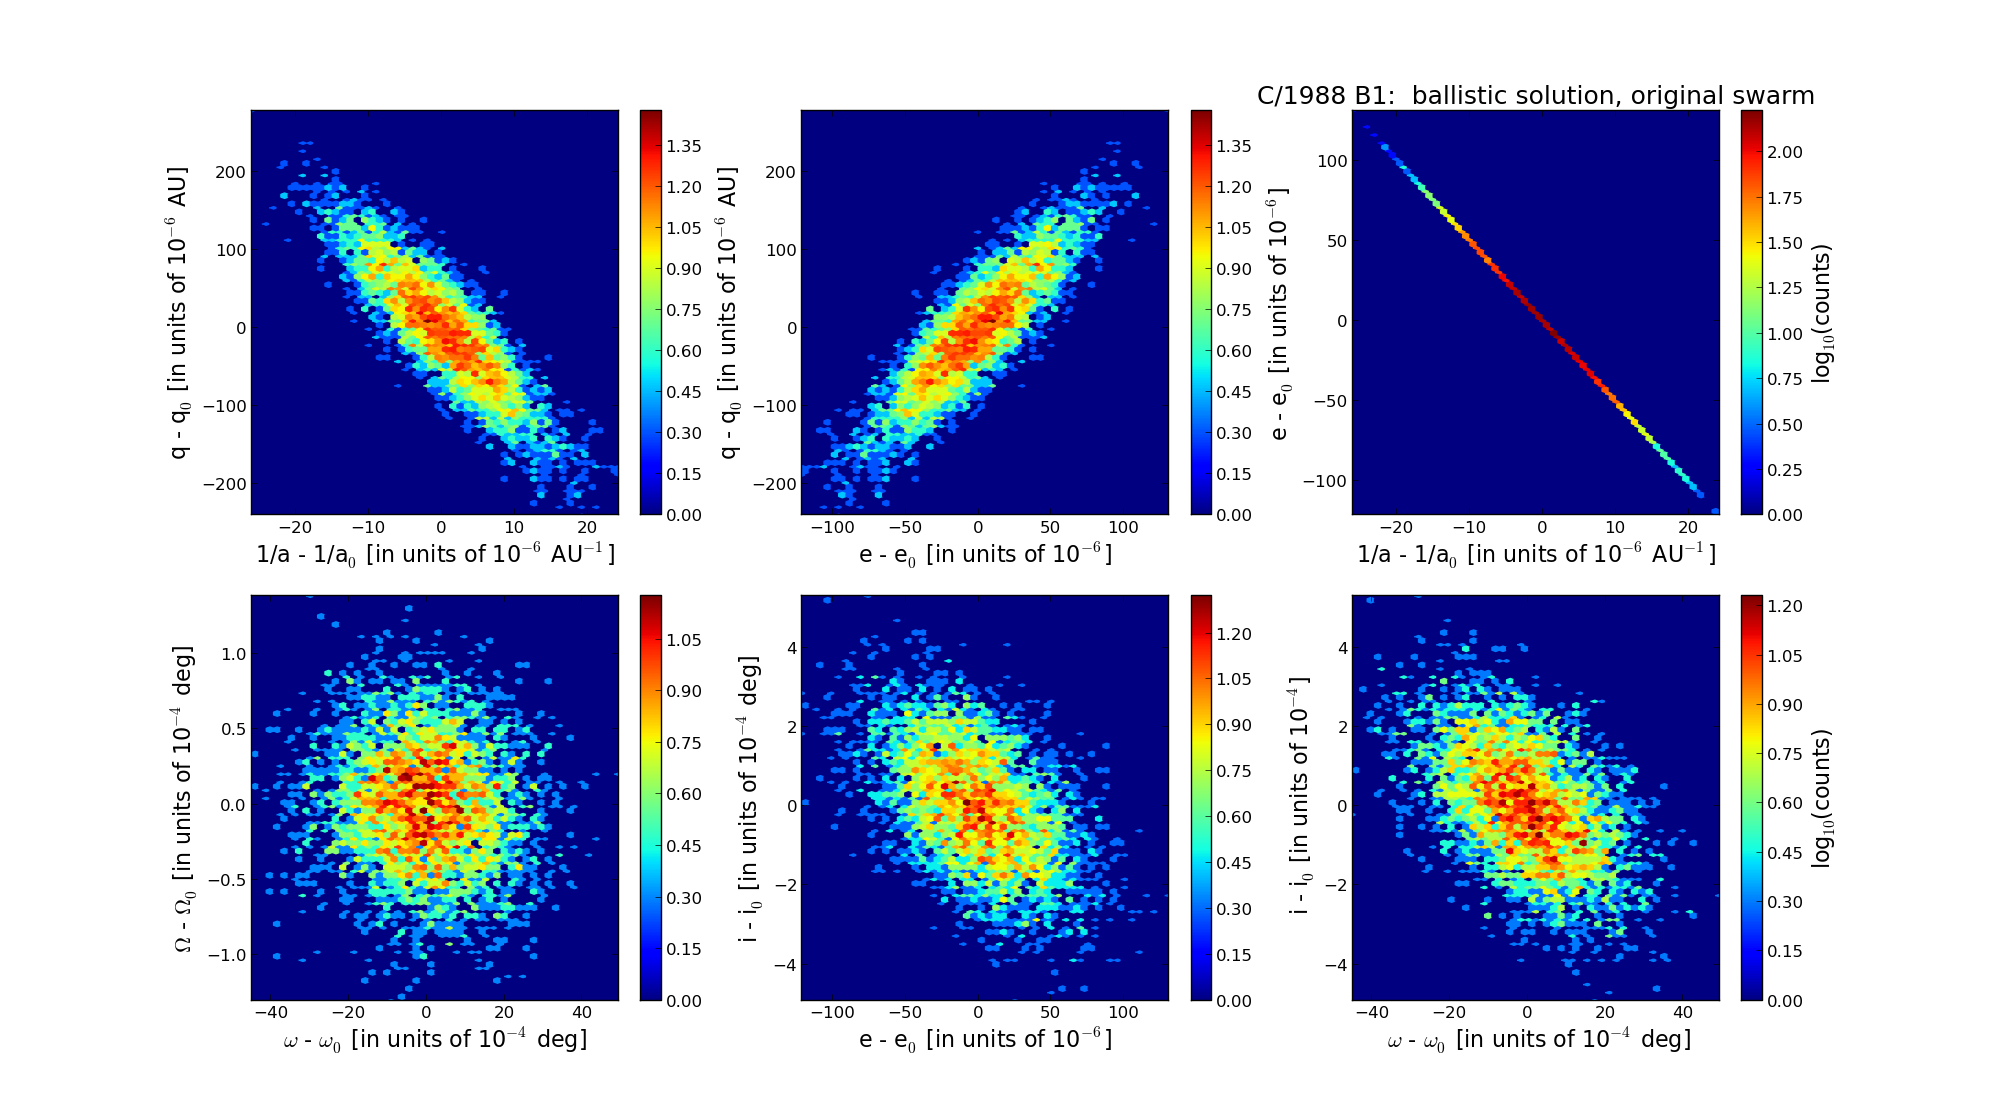
| inverse semimajor axis [10-6 au-1] | -493.98 | ± 7.03 |
| Epoch (TT) | 16811015 | |
| time of perihelion passage (TT) | 19870319.600552 | ± 0.009221 |
| perihelion distance | 5.03079825 | ± 0.00007241 |
| eccentricity | 0.99989942 | ± 0.00003516 |
| argument of perihelion [deg] | 124.243345 | ± 0.001322 |
| longitude of the ascending node [deg] | 325.210131 | ± 0.000038 |
| inclination [deg] | 80.573568 | ± 0.000139 |
| inverse semimajor axis [10-6 au-1] | 19.99 | ± 6.99 |
| Epoch (TT) | 22910220 | |
| time of perihelion passage (TT) | 19870319.919988 | ± 0.009039 |
| perihelion distance | 5.03103521 | ± 0.00007221 |
| eccentricity | 1.00054965 | ± 0.00003515 |
| argument of perihelion [deg] | 124.175688 | ± 0.001327 |
| longitude of the ascending node [deg] | 325.180830 | ± 0.000038 |
| inclination [deg] | 80.574313 | ± 0.000138 |
| inverse semimajor axis [10-6 au-1] | -109.25 | ± 6.99 |