| Solar System Dynamics & Planetology Group |
|
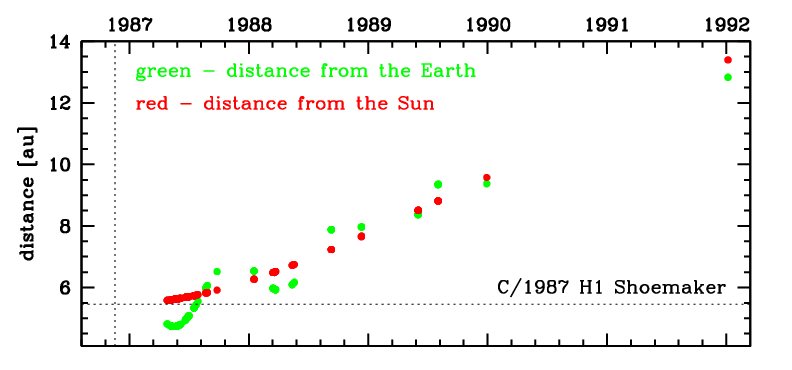
C/1987 H1 Shoemaker | |
| Solar System Dynamics & Planetology Group |
|
C/1987 H1 Shoemaker | |
| number of observations | 127 |
| number of residuals | 242 |
| data interval | 1987 Apr. 25 — 1992 Jan. 4 |
| rms [arcsec] | 0.91 |
| orbit quality class | 1a+ |
| Epoch (TT) | 19861126.0 | = JD 2446760.5 |
| time of perihelion passage (TT) | 19861117.104282 | ± 0.004053 |
| perihelion distance | 5.45751848 | ± 0.00003120 |
| eccentricity | 1.00284157 | ± 0.00001548 |
| argument of perihelion [deg] | 16.995673 | ± 0.000555 |
| longitude of the ascending node [deg] | 268.325863 | ± 0.000079 |
| inclination [deg] | 132.474265 | ± 0.000057 |
| inverse semimajor axis [10-6 au-1] | -520.67 | ± 2.83 |

| Epoch (TT) | 16800622 | |
| time of perihelion passage (TT) | 19861116.537694 | ± 0.004017 |
| perihelion distance | 5.45109244 | ± 0.00003114 |
| eccentricity | 0.99975221 | ± 0.00001545 |
| argument of perihelion [deg] | 16.935975 | ± 0.000553 |
| longitude of the ascending node [deg] | 268.239805 | ± 0.000079 |
| inclination [deg] | 132.519096 | ± 0.000056 |
| inverse semimajor axis [10-6 au-1] | 45.46 | ± 2.83 |
| Epoch (TT) | 22921012 | |
| time of perihelion passage (TT) | 19861115.095110 | ± 0.004087 |
| perihelion distance | 5.45463641 | ± 0.00003115 |
| eccentricity | 1.00003125 | ± 0.00001546 |
| argument of perihelion [deg] | 16.842456 | ± 0.000555 |
| longitude of the ascending node [deg] | 268.319709 | ± 0.000078 |
| inclination [deg] | 132.491937 | ± 0.000056 |
| inverse semimajor axis [10-6 au-1] | -5.73 | ± 2.83 |