| Solar System Dynamics & Planetology Group |
|
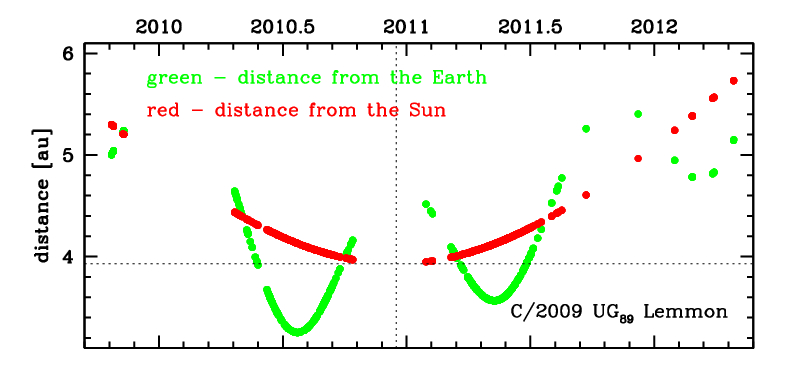
C/2009 UG89 Lemmon | |
| Solar System Dynamics & Planetology Group |
|
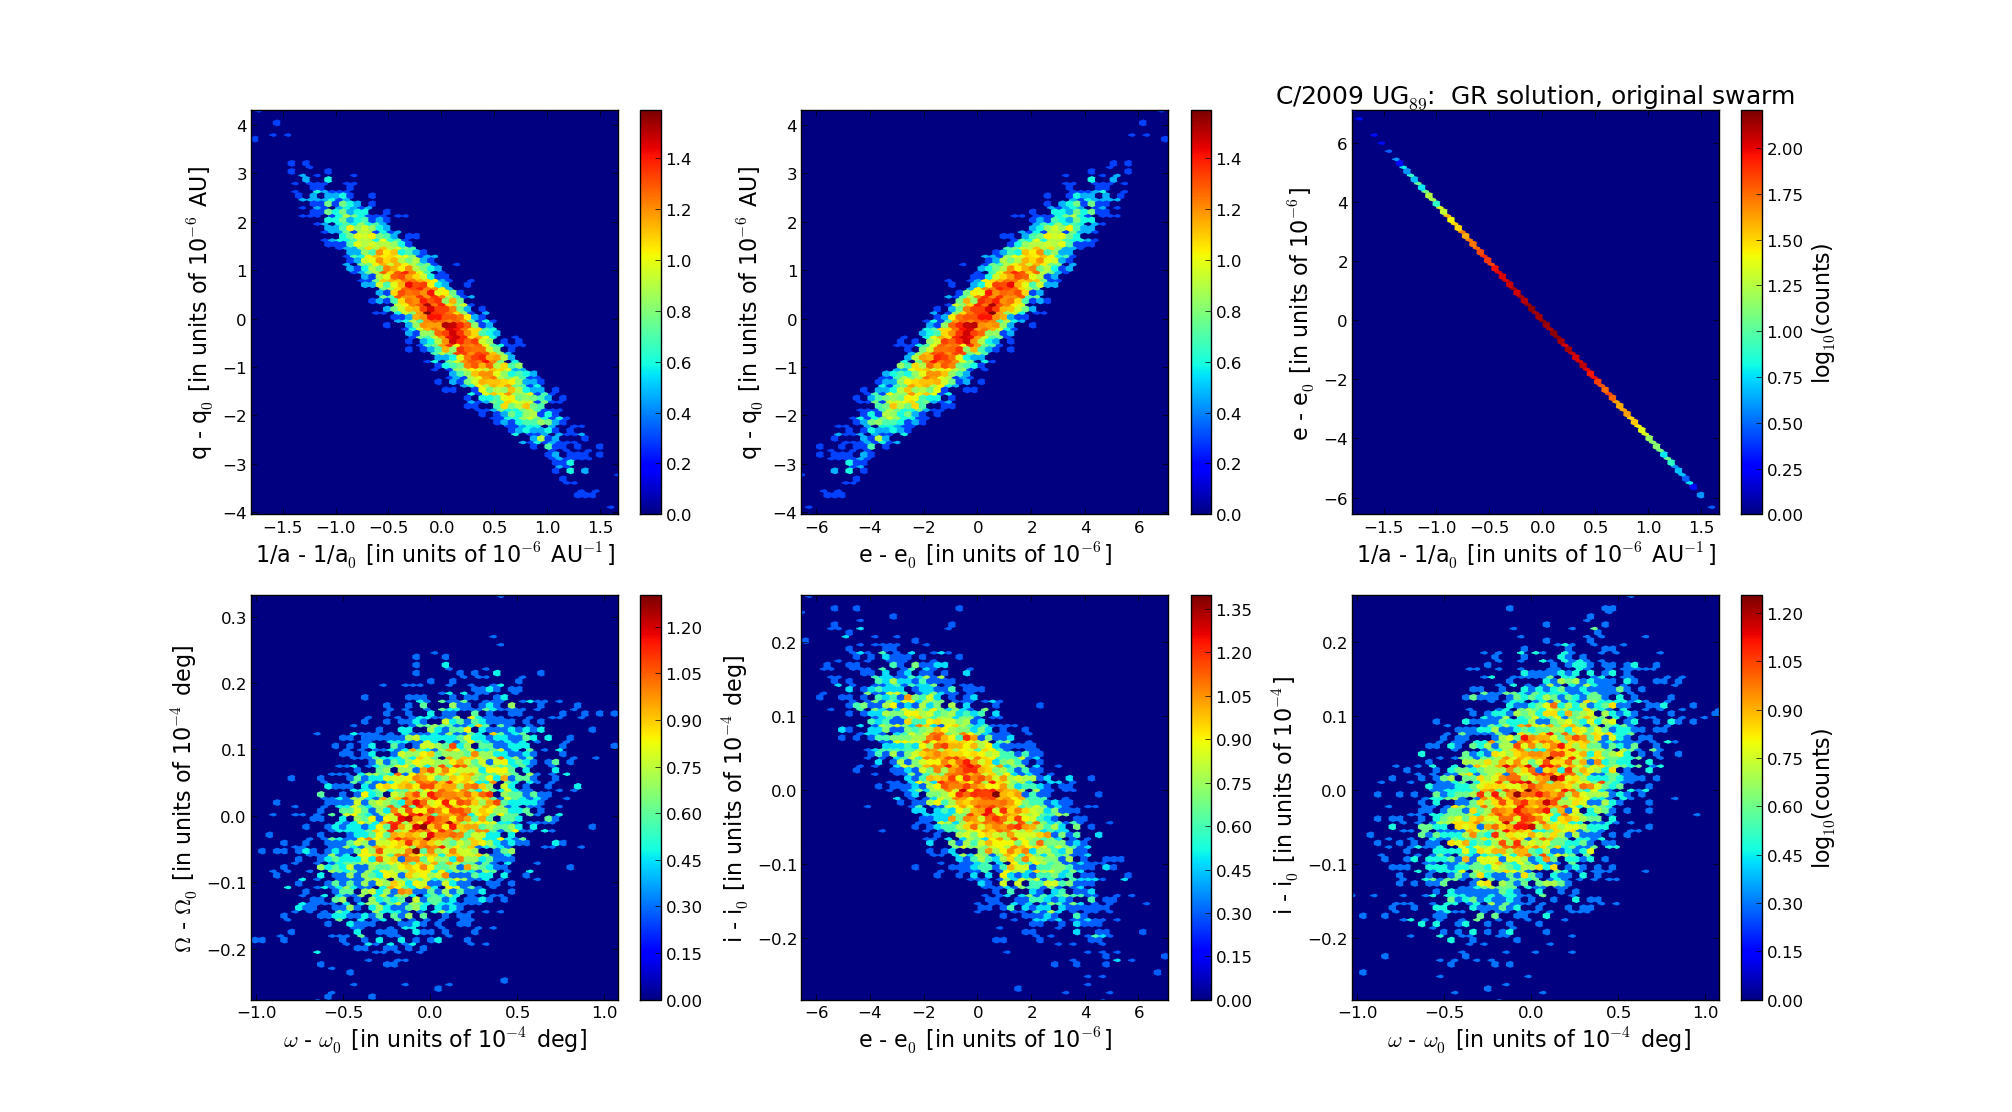
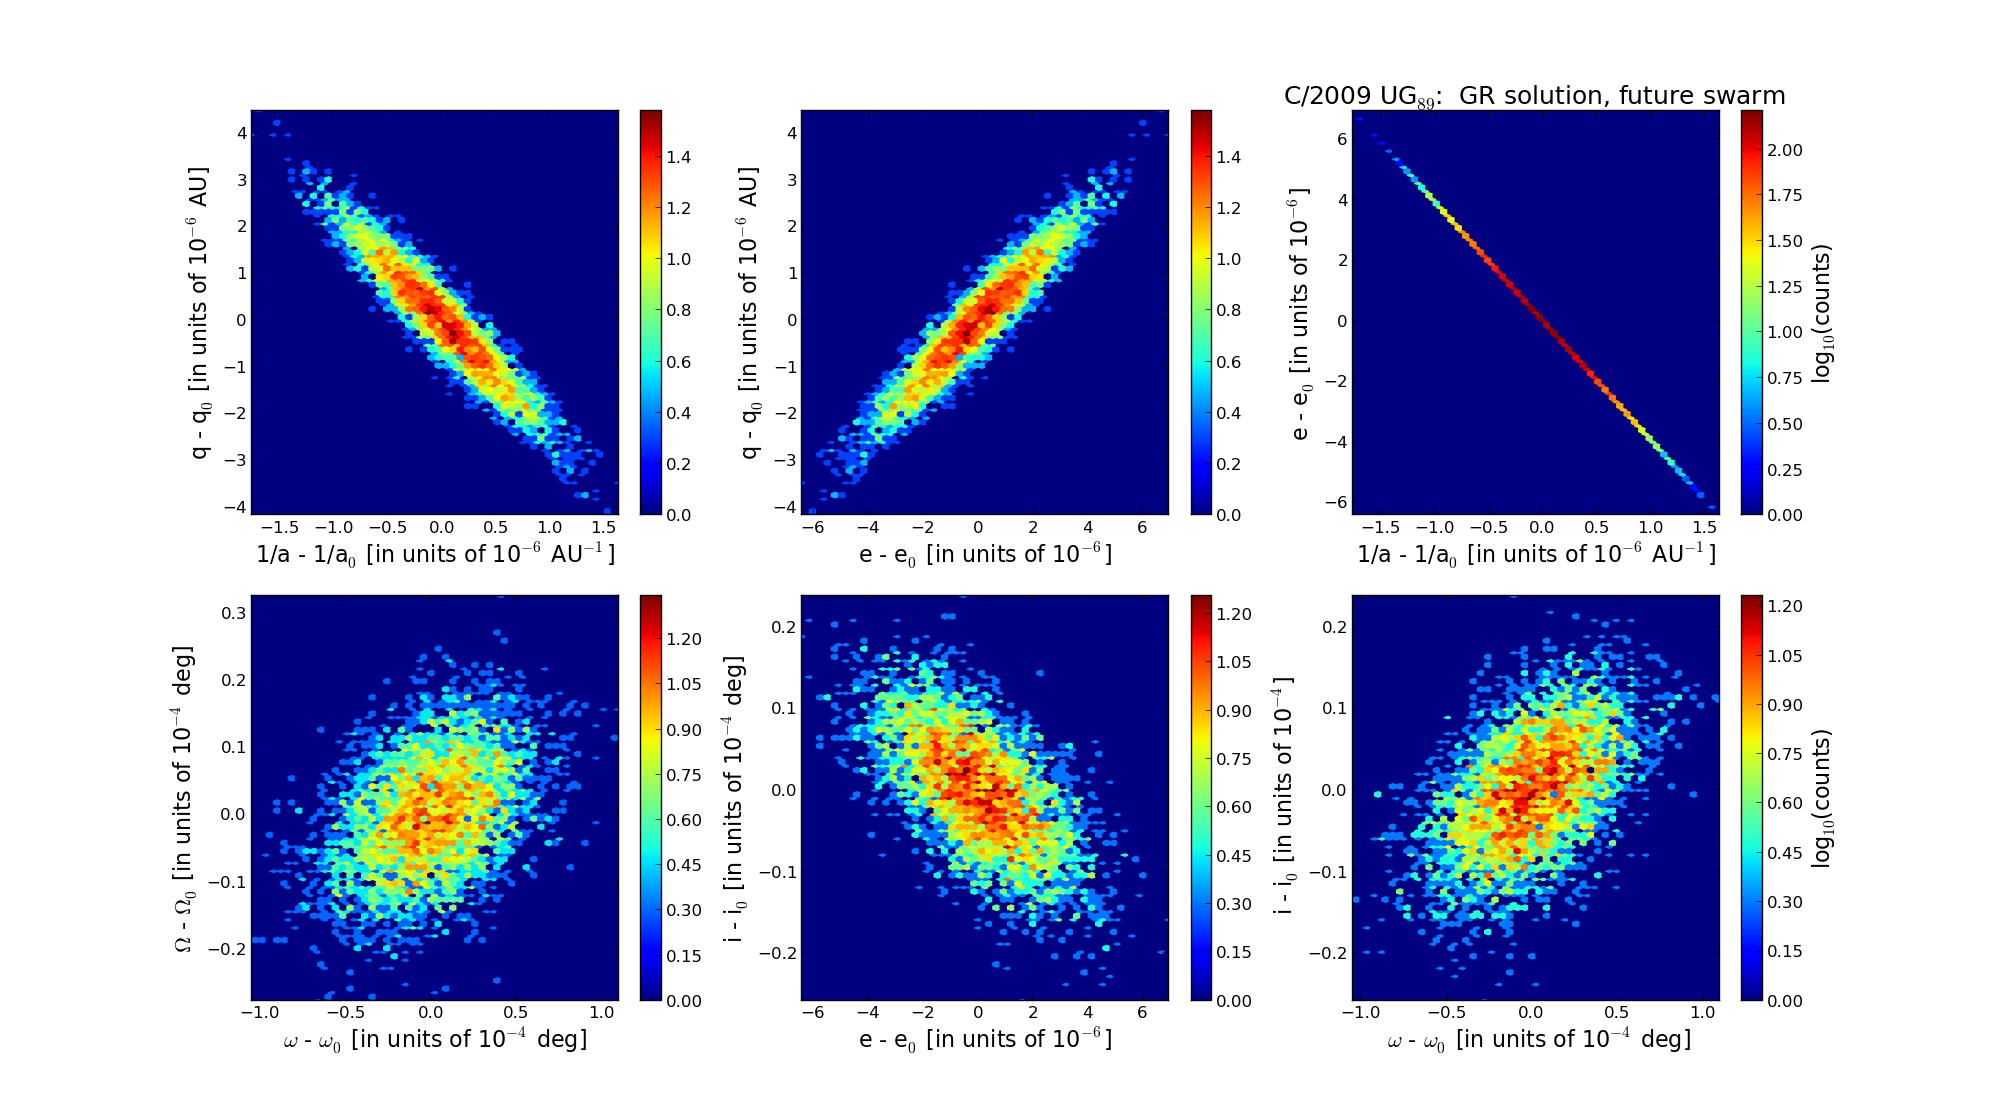
C/2009 UG89 Lemmon | |
| number of observations | 988 |
| number of residuals | 1938 |
| data interval | 2009 Oct. 22 — 2012 Apr. 27 |
| rms [arcsec] | 0.43 |
| orbit quality class | 1a+ |
| Epoch (TT) | 20101230.0 | = JD 2455560.5 |
| time of perihelion passage (TT) | 20101216.270246 | ± 0.000173 |
| perihelion distance | 3.93116688 | ± 0.00000113 |
| eccentricity | 1.00805713 | ± 0.00000183 |
| argument of perihelion [deg] | 60.653833 | ± 0.000029 |
| longitude of the ascending node [deg] | 321.008496 | ± 0.000008 |
| inclination [deg] | 130.100465 | ± 0.000007 |
| inverse semimajor axis [10-6 au-1] | -2049.55 | ± 0.47 |
| Epoch (TT) | 17051010 | |
| time of perihelion passage (TT) | 20101215.717896 | ± 0.000175 |
| perihelion distance | 3.94331616 | ± 0.00000107 |
| eccentricity | 0.99935483 | ± 0.00000189 |
| argument of perihelion [deg] | 60.375110 | ± 0.000029 |
| longitude of the ascending node [deg] | 321.002838 | ± 0.000008 |
| inclination [deg] | 130.344573 | ± 0.000008 |
| inverse semimajor axis [10-6 au-1] | 163.61 | ± 0.48 |
| Epoch (TT) | 22990218 | |
| time of perihelion passage (TT) | 20101215.222787 | ± 0.000174 |
| perihelion distance | 3.93075375 | ± 0.00000120 |
| eccentricity | 1.00562933 | ± 0.00000185 |
| argument of perihelion [deg] | 60.568963 | ± 0.000029 |
| longitude of the ascending node [deg] | 321.037062 | ± 0.000008 |
| inclination [deg] | 130.123598 | ± 0.000007 |
| inverse semimajor axis [10-6 au-1] | -1432.12 | ± 0.47 |